- Global stock markets were higher with European defense stocks leading the way Monday morning, interestingly enough.
- Gold skyrocketed again overnight with both the Cash Index and February futures contract gaining more than $100 on increased global turmoil.
- While stock prices for US energy companies were higher pre-market, both Brent and WTI futures markets were under pressure.
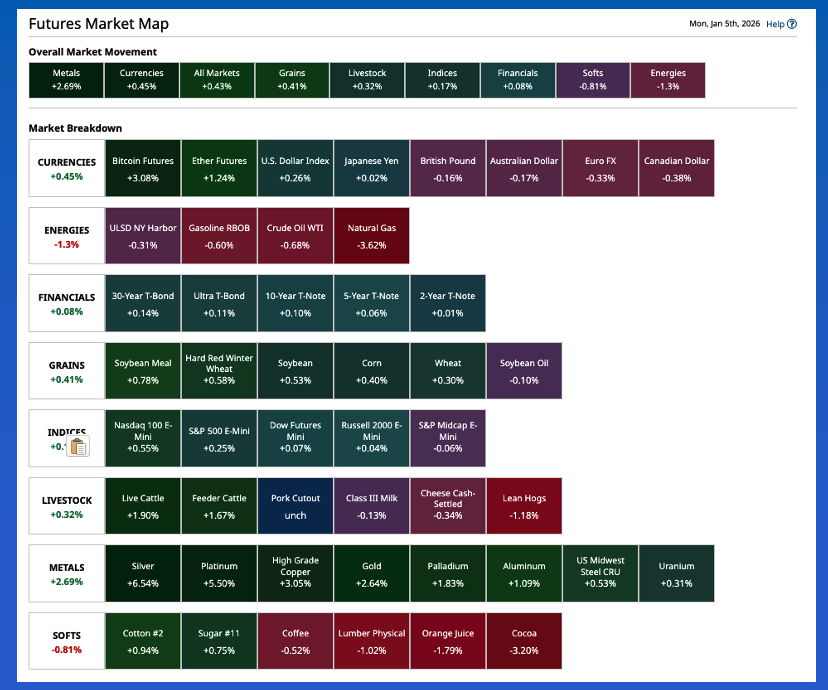
Morning Summary: I watched with interest how markets opened Sunday night, given the action by the United States in Venezuela over the weekend. There were two key markets tied to the situation, two of the Kings of Commodities: Crude Oil and Gold. Let’s start with crude. Make no mistake, this was about the oil. Venezuela has the world’s largest underground reserves, and China is one of Venezuela’s most important customers. (As would be expected, China condemned the US takeover of Venezuela.) The US president has made a number of statements since initiating the attack, a good deal of it from the same script Russia’s Putin used nearly four years ago to justify his illegal invasion of Ukraine, with the common theme being he wanted Venezuela’s oil. Given this, it is not surprising pre-market trade in oil company stocks shows solid gains nearly across the board. As for the crude oil market, the spot-month WTI (CLG26) and Brent (QAH26) contracts lost as much as $1 overnight. What about gold? The Cash Index (GCY00) gained as much as $101 (2.3%) while the nearby Feb futures contract (GCG26) jumped $114 (2.6%) to start the week. It’s also interesting to note European defense stocks rallied early Monday due in large part to the increased turmoil created this weekend.
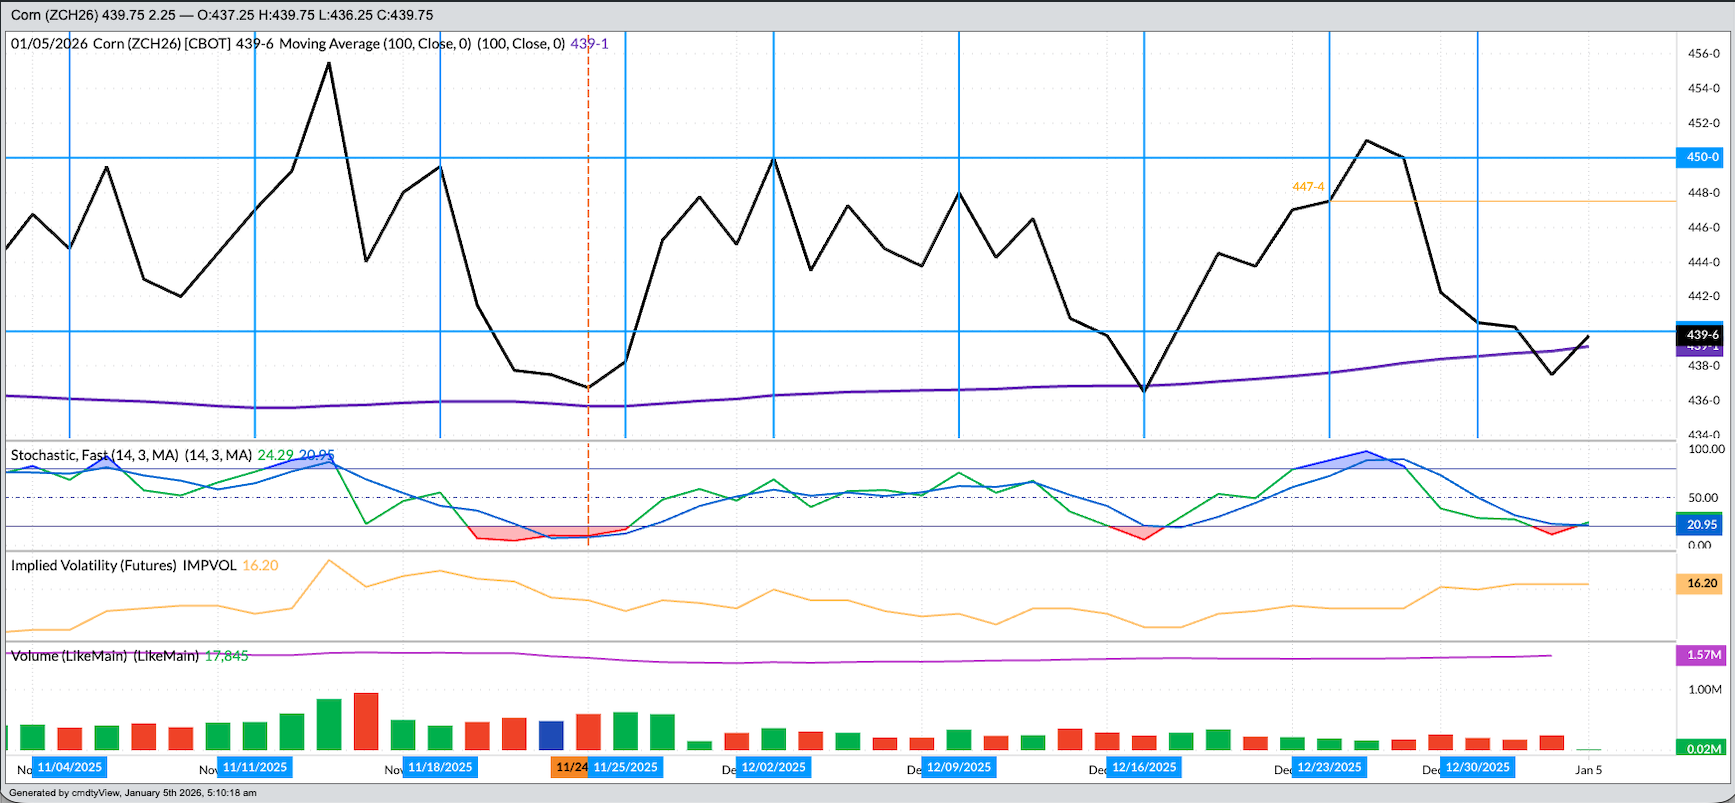
Corn: The third King of Commodities, King Corn, stayed out of the fray for now, showing light trade volume pre-dawn Monday with contracts in the green across the board. Fundamentally, the market hasn’t changed. The National Corn Index ($CNCI) was priced last Friday near $4.0025, putting national average basis at 37.25 cents under March futures (ZCH26) as compared to the previous 5-year low weekly close for last week of 27.0 cents under with the previous 10-year low weekly close at 35.25 cents under. Fundamentally, then, the intrinsic value of the market is low, with the $4.00 price putting the Index in the lower 18% of its price distribution range based on monthly closes only back through 2021, and national average basis is weak. It’s the same market in a new year. Later this morning we will get the next round of weekly export sales and shipments, for the week ending Thursday, December 25, with the pace projection for US corn shipments expected to continue to slow down. This afternoon we will get the next set of Commitments of Traders reports for the week ending Tuesday, December 30. Recall the March issue closed 7.0 cents lower that week, from Tuesday-to-Tuesday, indicating noncommercial selling.
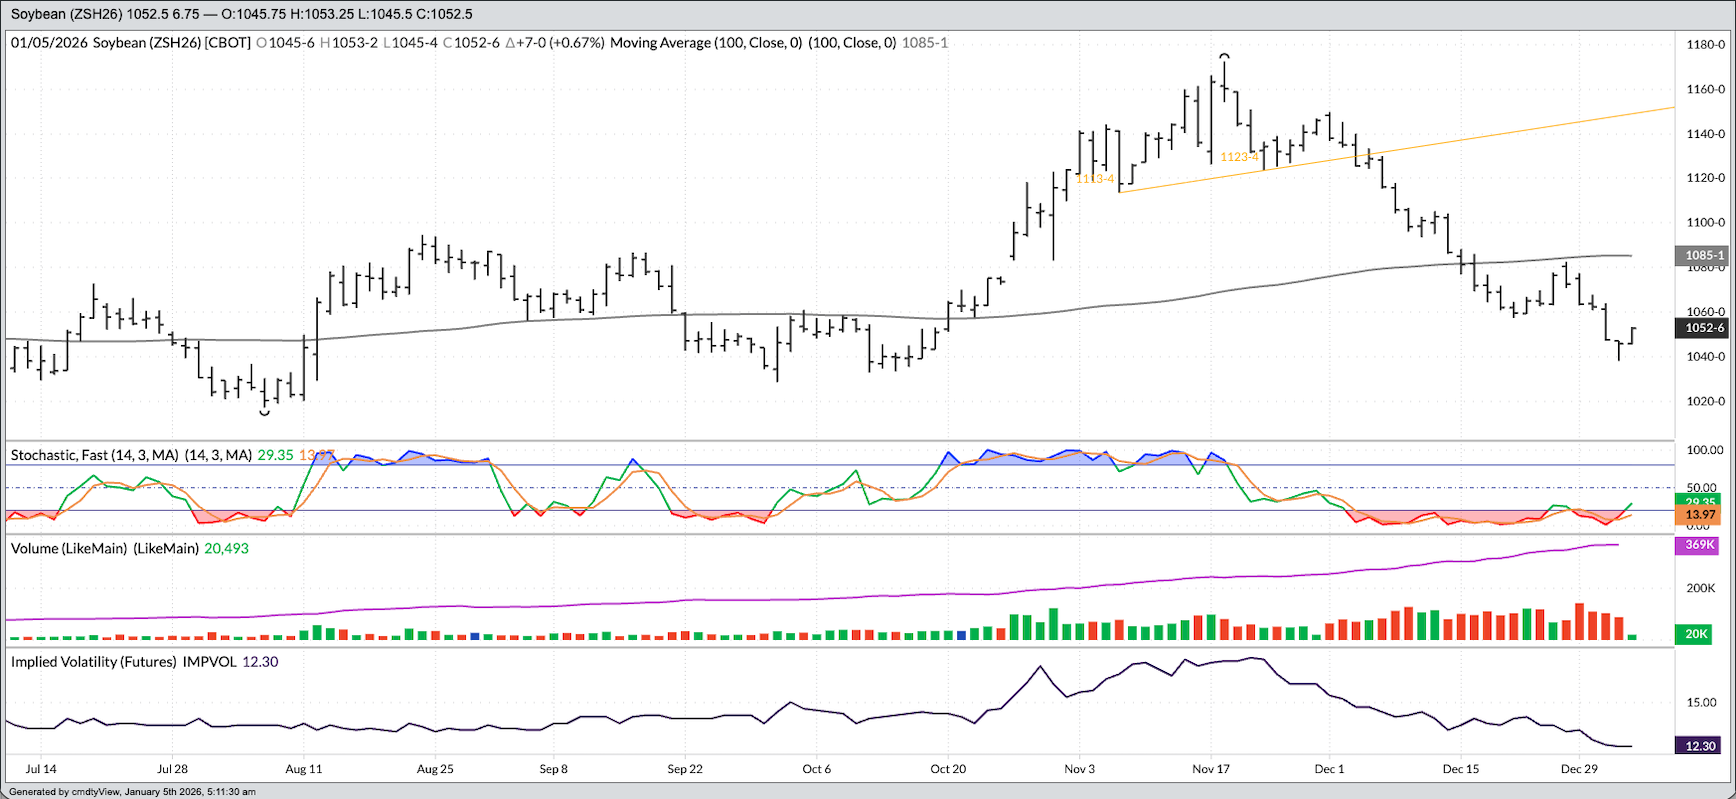
Soybeans: The soybean market was also interesting overnight. I wasn’t sure how soybeans would react to increased destabilization of the relationship between the US and China, if such a thing is possible. The March issue (ZSH26) opened unchanged, setting its overnight session low before rallying as much as 6.75 cents on still light trade volume of 17,000 contracts. Since it seems like a lifetime ago, a recap of last Friday’s session is in order. March extended the short-term downtrend on its daily chart by as much as 9.5 cents, hitting a low of $10.38, its lowest mark since October 15, before closing at $10.4575, down only 1.75 cents for the day. This told us someone was doing some buying near the low. When the National Soybean Index ($CNSI) came out Friday night, it was priced at $9.7125, up 2.0 cents for the day. In other words, national average basis firmed by nearly 4.0 cents to close out the week, usually an indicator of a spike in immediate-term demand. Given all this, it would not be surprising to see USDA announce export sales later Monday morning. Speaking of exports, it will be interesting to see if the most recent sales and shipments numbers for soybeans are corrected following multiple errors reported with the previous set.
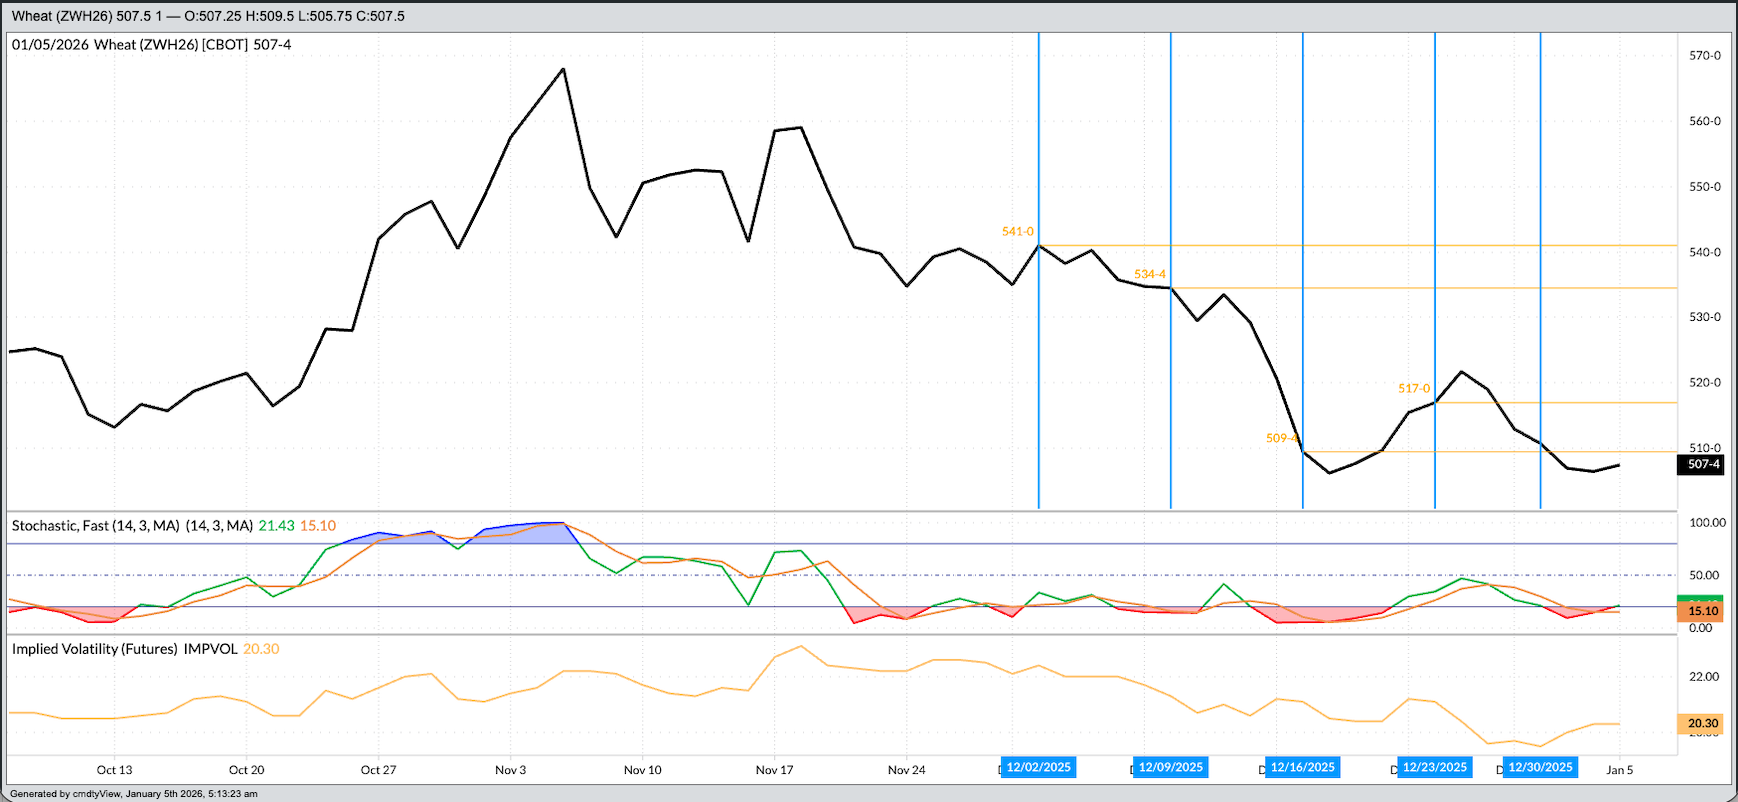
Wheat: The wheat sub-sector was in the green across the board early Monday morning. Trade volume was light, for the most part, though March SRW (ZWH26) registered 5,100 contracts traded as of this writing. That isn’t heavy but stands out given what we see with the rest of the sub-sector. March posted a 3.75-cent trading range, from down 0.75 cent to up 3.0 cents and was sitting 2.25 cents higher at this writing. What do I make of this? Not much, but it could be hinting at a light round of noncommercial short-covering coming out of the weekend. Recall the previous Commitments of Traders report, for the week ending Tuesday, December 23, showed Watson increased its net-short futures position by 21,666 contracts, putting it at 71,832 contracts, the largest net-short since 80,232 contracts on Tuesday, October 21. The week ending Tuesday, December 30 saw March SRW down another 6.25 cents indicating the noncommercial net-short futures position likely grew larger. As for weekly export sales and shipments, the previous update showed the pace projection for all US wheat still up 27% from last year’s reported total shipments of 776 mb. Despite this, all three National Wheat Indexes were below previous 5-year end of December lows as last month ended.
On the date of publication, Darin Newsom did not have (either directly or indirectly) positions in any of the securities mentioned in this article. All information and data in this article is solely for informational purposes. For more information please view the Barchart Disclosure Policy here.
More news from Barchart