


- Third quarter 2023 net earnings of $299 million, or $1.20 per diluted share
- Third quarter 2023 adjusted net earnings of $350 million, or $1.40 per diluted share
- Third quarter 2023 adjusted EBITDA of $578 million
United States Steel Corporation (NYSE: X) reported third quarter 2023 net earnings of $299 million, or $1.20 per diluted share. Adjusted net earnings was $350 million, or $1.40 per diluted share. This compares to third quarter 2022 net earnings of $490 million, or $1.85 per diluted share. Adjusted net earnings for the third quarter 2022 was $526 million, or $1.98 per diluted share.
This press release features multimedia. View the full release here: https://www.businesswire.com/news/home/20231026322773/en/
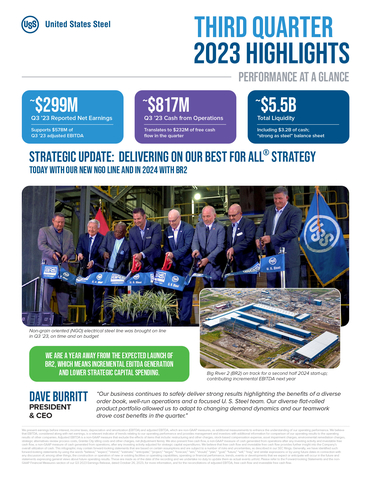
United States Steel Corporation Third Quarter 2023 Highlights (Photo: Business Wire)
Commenting on the third quarter’s performance, U. S. Steel President and Chief Executive Officer David B. Burritt said, “Our business continues to safely deliver strong results highlighting the benefits of a diverse order book, well-run operations and a focused U. S. Steel team. Our diverse flat-rolled product portfolio allowed us to adapt to changing demand dynamics and our teamwork drove cost benefits in the quarter.”
Commenting on the Company’s Best for All® strategy, Burritt continued, “The third quarter marked another key milestone towards our Best for All future. Our non-grain oriented, or NGO, electrical steel line produced its first coil in September and first industrial grade coil in October. NGO steel is essential to our country’s green energy future and serves the automotive and power generation sectors. Our NGO line can produce the thinnest gauges, widest widths, and biggest coils in the domestic industry today. This investment further expands our capabilities to meet customers’ needs. The nearly $4 billion of strategic investment in the Mini Mill segment is progressing on-time and budget.”
Separately, Burritt provided an update on the Company's ongoing strategic alternatives review process, “As we announced in August, the Board of Directors, with the assistance of the management team and its advisors, is fully engaged in and is progressing a robust and competitive strategic alternatives review process to maximize stockholder value. Meanwhile, we are focused on running our business safely, delivering on our commitments to customers and executing on our on-going strategic investments to increase stockholder value. We continue to see strong performance in each of these areas. Thank you to our employees for remaining focused on the tasks at-hand and for continuing to put safety first while delivering the high quality steel customers expect.”
Earnings Highlights |
||||||||||||
|
Three Months Ended
|
Nine Months Ended
|
||||||||||
(Dollars in millions, except per share amounts) |
|
2023 |
|
|
2022 |
|
|
2023 |
|
|
2022 |
|
Net Sales |
$ |
4,431 |
|
$ |
5,203 |
|
$ |
13,909 |
|
$ |
16,727 |
|
Segment earnings (loss) before interest and income taxes |
|
|
|
|
||||||||
Flat-Rolled |
$ |
225 |
|
$ |
518 |
|
$ |
449 |
|
$ |
1,840 |
|
Mini Mill |
|
42 |
|
|
1 |
|
|
186 |
|
|
549 |
|
U. S. Steel Europe |
|
(13 |
) |
|
(32 |
) |
|
25 |
|
|
512 |
|
Tubular |
|
87 |
|
|
155 |
|
|
476 |
|
|
339 |
|
Other |
|
7 |
|
|
21 |
|
|
(2 |
) |
|
16 |
|
Total segment earnings before interest and income taxes |
$ |
348 |
|
$ |
663 |
|
$ |
1,134 |
|
$ |
3,256 |
|
Other items not allocated to segments |
|
(71 |
) |
|
(49 |
) |
|
(104 |
) |
|
(270 |
) |
Earnings before interest and income taxes |
$ |
277 |
|
$ |
614 |
|
$ |
1,030 |
|
$ |
2,986 |
|
Net interest and other financial benefits |
|
(64 |
) |
|
(30 |
) |
|
(182 |
) |
|
(48 |
) |
Income tax expense |
|
42 |
|
|
154 |
|
|
237 |
|
|
684 |
|
Net earnings |
$ |
299 |
|
$ |
490 |
|
$ |
975 |
|
$ |
2,350 |
|
Earnings per diluted share |
$ |
1.20 |
|
$ |
1.85 |
|
$ |
3.86 |
|
$ |
8.38 |
|
|
|
|
|
|
||||||||
Adjusted net earnings (a) |
$ |
350 |
|
$ |
526 |
|
$ |
1,028 |
|
$ |
2,552 |
|
Adjusted net earnings per diluted share (a) |
$ |
1.40 |
|
$ |
1.98 |
|
$ |
4.07 |
|
$ |
9.06 |
|
Adjusted earnings before interest, income taxes, depreciation and amortization (EBITDA) (a) |
$ |
578 |
|
$ |
861 |
|
$ |
1,809 |
|
$ |
3,850 |
|
(a) Please refer to the non-GAAP Financial Measures section of this document for the reconciliation of these amounts. The prior year was retroactively adjusted to reflect the reclassification of stock-based compensation expense. |
||||||||||||
*****
The Company will conduct a conference call on the third quarter earnings on Friday, October 27, 2023, at 8:30 a.m. Eastern. To listen to the webcast of the conference call and to access the Company's slide presentation, visit the U. S. Steel website, www.ussteel.com, and click on the “Investors” section. Replay will be available on the website after 10:30 a.m. Eastern on October 27, 2023.
UNITED STATES STEEL CORPORATION |
||||||||||||||
PRELIMINARY SUPPLEMENTAL STATISTICS (Unaudited) |
||||||||||||||
|
|
Three Months Ended
|
|
Nine Months Ended
|
||||||||||
|
|
|
2023 |
|
|
2022 |
|
|
|
2023 |
|
|
2022 |
|
OPERATING STATISTICS |
|
|
|
|
|
|||||||||
Average realized price: ($/net ton unless otherwise noted) (a) |
|
|
|
|
|
|||||||||
|
Flat-Rolled |
|
1,036 |
|
|
1,232 |
|
|
|
1,045 |
|
|
1,312 |
|
|
Mini Mill |
|
901 |
|
|
1,096 |
|
|
|
898 |
|
|
1,268 |
|
|
U. S. Steel Europe |
|
852 |
|
|
1,021 |
|
|
|
910 |
|
|
1,121 |
|
|
U. S. Steel Europe (€/net ton) |
|
783 |
|
|
1,013 |
|
|
|
840 |
|
|
1,049 |
|
|
Tubular |
|
2,927 |
|
|
3,217 |
|
|
|
3,422 |
|
|
2,761 |
|
|
|
|
|
|
|
|
||||||||
Steel shipments (thousands of net tons): (a) |
|
|
|
|
|
|||||||||
|
Flat-Rolled |
|
2,159 |
|
|
2,176 |
|
|
|
6,672 |
|
|
6,488 |
|
|
Mini Mill |
|
561 |
|
|
529 |
|
|
|
1,807 |
|
|
1,651 |
|
|
U. S. Steel Europe |
|
958 |
|
|
867 |
|
|
|
2,875 |
|
|
3,044 |
|
|
Tubular |
|
104 |
|
|
126 |
|
|
|
346 |
|
|
390 |
|
|
Total steel shipments |
|
3,782 |
|
|
3,698 |
|
|
|
11,700 |
|
|
11,573 |
|
|
|
|
|
|
|
|
||||||||
Intersegment steel (unless otherwise noted) shipments (thousands of net tons): |
|
|
|
|
|
|||||||||
|
Mini Mill to Flat-Rolled |
|
145 |
|
|
53 |
|
|
|
370 |
|
|
252 |
|
|
Flat-Rolled to Mini Mill |
|
2 |
|
|
7 |
|
|
|
2 |
|
|
30 |
|
|
Flat-Rolled to Mini Mill (pig iron) |
|
95 |
|
|
— |
|
|
|
210 |
|
|
— |
|
|
Flat-Rolled to USSE |
|
— |
|
|
— |
|
|
|
— |
|
|
30 |
|
|
Flat-Rolled to USSE (b) |
|
174 |
|
|
62 |
|
|
|
632 |
|
|
144 |
|
|
|
|
|
|
|
|
||||||||
Raw steel production (thousands of net tons): |
|
|
|
|
|
|||||||||
|
Flat-Rolled |
|
2,390 |
|
|
2,265 |
|
|
|
7,312 |
|
|
6,894 |
|
|
Mini Mill |
|
693 |
|
|
616 |
|
|
|
2,201 |
|
|
1,967 |
|
|
U. S. Steel Europe |
|
990 |
|
|
946 |
|
|
|
3,295 |
|
|
3,250 |
|
|
Tubular |
|
111 |
|
|
173 |
|
|
|
411 |
|
|
497 |
|
|
|
|
|
|
|
|
||||||||
Raw steel capability utilization: (c) |
|
|
|
|
|
|||||||||
|
Flat-Rolled |
|
72 |
% |
|
68 |
% |
|
|
74 |
% |
|
70 |
% |
|
Mini Mill |
|
83 |
% |
|
74 |
% |
|
|
89 |
% |
|
80 |
% |
|
U. S. Steel Europe |
|
79 |
% |
|
75 |
% |
|
|
88 |
% |
|
87 |
% |
|
Tubular |
|
49 |
% |
|
76 |
% |
|
|
61 |
% |
|
74 |
% |
|
|
|
|
|
|
|
||||||||
CAPITAL EXPENDITURES (dollars in millions) |
|
|
|
|
|
|||||||||
|
Flat-Rolled |
|
132 |
|
|
136 |
|
|
|
375 |
|
|
365 |
|
|
Mini Mill |
|
423 |
|
|
320 |
|
|
|
1,474 |
|
|
710 |
|
|
U. S. Steel Europe |
|
24 |
|
|
19 |
|
|
|
66 |
|
|
53 |
|
|
Tubular |
|
7 |
|
|
3 |
|
|
|
24 |
|
|
10 |
|
|
Other Businesses |
|
— |
|
|
— |
|
|
|
— |
|
|
— |
|
|
Total |
$ |
586 |
|
$ |
478 |
|
|
$ |
1,939 |
|
$ |
1,138 |
|
(a) Excludes intersegment shipments. |
||||||||||||||
(b) Consists of coal in 2023 and iron ore pellets and fines in 2022. |
||||||||||||||
(c) Based on annual raw steel production capability of 13.2 million net tons for Flat-Rolled, 3.3 million net tons for Mini Mill, 5.0 million net tons for U. S. Steel Europe and 0.9 million net tons for Tubular. |
||||||||||||||
UNITED STATES STEEL CORPORATION |
|||||||||||||
CONDENSED STATEMENT OF OPERATIONS (Unaudited) |
|||||||||||||
|
Three Months Ended
|
|
Nine Months Ended
|
||||||||||
(Dollars in millions, except per share amounts) |
|
2023 |
|
|
2022 |
|
|
|
2023 |
|
|
2022 |
|
Net Sales |
$ |
4,431 |
|
$ |
5,203 |
|
|
$ |
13,909 |
|
$ |
16,727 |
|
|
|
|
|
|
|
||||||||
Operating expenses (income): |
|
|
|
|
|
||||||||
Cost of sales |
|
3,838 |
|
|
4,359 |
|
|
|
11,952 |
|
|
12,843 |
|
Selling, general and administrative expenses |
|
118 |
|
|
95 |
|
|
|
320 |
|
|
324 |
|
Depreciation, depletion and amortization |
|
230 |
|
|
198 |
|
|
|
675 |
|
|
594 |
|
Earnings from investees |
|
(51 |
) |
|
(71 |
) |
|
|
(76 |
) |
|
(202 |
) |
Asset impairment charges |
|
— |
|
|
— |
|
|
|
4 |
|
|
157 |
|
Restructuring and other charges |
|
18 |
|
|
23 |
|
|
|
21 |
|
|
57 |
|
Other gains, net |
|
1 |
|
|
(15 |
) |
|
|
(17 |
) |
|
(32 |
) |
Total operating expenses |
|
4,154 |
|
|
4,589 |
|
|
|
12,879 |
|
|
13,741 |
|
|
|
|
|
|
|
||||||||
Earnings before interest and income taxes |
|
277 |
|
|
614 |
|
|
|
1,030 |
|
|
2,986 |
|
Net interest and other financial benefits |
|
(64 |
) |
|
(30 |
) |
|
|
(182 |
) |
|
(48 |
) |
|
|
|
|
|
|
||||||||
Earnings before income taxes |
|
341 |
|
|
644 |
|
|
|
1,212 |
|
|
3,034 |
|
Income tax expense |
|
42 |
|
|
154 |
|
|
|
237 |
|
|
684 |
|
|
|
|
|
|
|
||||||||
Net earnings |
|
299 |
|
|
490 |
|
|
|
975 |
|
|
2,350 |
|
Less: Net earnings attributable to noncontrolling interests |
|
— |
|
|
— |
|
|
|
— |
|
|
— |
|
Net earnings attributable to United States Steel Corporation |
$ |
299 |
|
$ |
490 |
|
|
$ |
975 |
|
$ |
2,350 |
|
|
|
|
|
|
|
||||||||
COMMON STOCK DATA: |
|
|
|
|
|
||||||||
Net earnings per share attributable to United States Steel Corporation Stockholders |
|
|
|
|
|
||||||||
Basic |
$ |
1.34 |
|
$ |
2.07 |
|
|
$ |
4.33 |
|
$ |
9.33 |
|
Diluted |
$ |
1.20 |
|
$ |
1.85 |
|
|
$ |
3.86 |
|
$ |
8.38 |
|
Weighted average shares, in thousands |
|
|
|
|
|
||||||||
Basic |
|
223,109 |
|
|
237,094 |
|
|
|
225,311 |
|
|
251,848 |
|
Diluted |
|
253,070 |
|
|
266,264 |
|
|
|
255,080 |
|
|
281,569 |
|
Dividends paid per common share |
$ |
0.05 |
|
$ |
0.05 |
|
|
$ |
0.15 |
|
$ |
0.15 |
|
UNITED STATES STEEL CORPORATION |
|||||||
CONDENSED CASH FLOW STATEMENT (Unaudited) |
|||||||
|
|
Nine Months Ended
|
Nine Months Ended
|
||||
(Dollars in millions) |
|
2023 |
|
|
2022 |
|
|
Increase (decrease) in cash, cash equivalents and restricted cash |
|||||||
Operating activities: |
|
|
|||||
|
Net earnings |
$ |
975 |
|
$ |
2,350 |
|
|
Depreciation, depletion and amortization |
|
675 |
|
|
594 |
|
|
Asset impairment charges |
|
4 |
|
|
157 |
|
|
Restructuring and other charges |
|
21 |
|
|
57 |
|
|
Pensions and other postretirement benefits |
|
(124 |
) |
|
(164 |
) |
|
Deferred income taxes |
|
275 |
|
|
561 |
|
|
Working capital changes |
|
227 |
|
|
(545 |
) |
|
Income taxes receivable/payable |
|
(86 |
) |
|
(88 |
) |
|
Other operating activities |
|
(256 |
) |
|
(172 |
) |
Net cash provided by operating activities |
|
1,711 |
|
|
2,750 |
|
|
|
|
|
|
||||
Investing activities: |
|
|
|||||
|
Capital expenditures |
|
(1,939 |
) |
|
(1,138 |
) |
|
Proceeds from cost reimbursement government grants |
|
— |
|
|
53 |
|
|
Proceeds from sale of assets |
|
4 |
|
|
28 |
|
|
Other investing activities |
|
— |
|
|
(8 |
) |
Net cash used in investing activities |
|
(1,935 |
) |
|
(1,065 |
) |
|
|
|
|
|
||||
Financing activities: |
|
|
|||||
|
Issuance of long-term debt, net of financing costs |
|
241 |
|
|
291 |
|
|
Repayment of long-term debt |
|
(69 |
) |
|
(375 |
) |
|
Common stock repurchased |
|
(175 |
) |
|
(699 |
) |
|
Proceeds from government incentives |
|
— |
|
|
82 |
|
|
Other financing activities |
|
(50 |
) |
|
(51 |
) |
Net cash provided by (used in) financing activities |
|
(53 |
) |
|
(752 |
) |
|
|
|
|
|
||||
Effect of exchange rate changes on cash |
|
(3 |
) |
|
(46 |
) |
|
|
|
|
|
||||
Net (decrease) increase in cash, cash equivalents and restricted cash |
|
(280 |
) |
|
887 |
|
|
Cash, cash equivalents and restricted cash at beginning of year |
|
3,539 |
|
|
2,600 |
|
|
|
|
|
|
||||
Cash, cash equivalents and restricted cash at end of period |
$ |
3,259 |
|
$ |
3,487 |
|
|
UNITED STATES STEEL CORPORATION |
|||||
CONDENSED BALANCE SHEET (Unaudited) |
|||||
|
|
September 30, |
December 31, |
||
(Dollars in millions) |
|
2023 |
|
2022 |
|
Cash and cash equivalents |
$ |
3,222 |
$ |
3,504 |
|
Receivables, net |
|
1,541 |
|
1,635 |
|
Inventories |
|
2,304 |
|
2,359 |
|
Other current assets |
|
328 |
|
368 |
|
|
Total current assets |
|
7,395 |
|
7,866 |
|
|
|
|
||
Operating lease assets |
|
116 |
|
146 |
|
Property, plant and equipment, net |
|
9,911 |
|
8,492 |
|
Investments and long-term receivables, net |
|
863 |
|
840 |
|
Intangibles, net |
|
447 |
|
478 |
|
Goodwill |
|
920 |
|
920 |
|
Other noncurrent assets |
|
743 |
|
716 |
|
|
Total assets |
$ |
20,395 |
$ |
19,458 |
|
|
|
|
||
Accounts payable and other accrued liabilities |
|
2,939 |
|
3,016 |
|
Payroll and benefits payable |
|
498 |
|
493 |
|
Short-term debt and current maturities of long-term debt |
|
98 |
|
63 |
|
Other current liabilities |
|
266 |
|
387 |
|
|
Total current liabilities |
|
3,801 |
|
3,959 |
|
|
|
|
||
Noncurrent operating lease liabilities |
|
79 |
|
105 |
|
Long-term debt, less unamortized discount and debt issuance costs |
|
4,129 |
|
3,914 |
|
Employee benefits |
|
138 |
|
209 |
|
Deferred income tax liabilities |
|
712 |
|
456 |
|
Other long-term liabilities |
|
439 |
|
504 |
|
United States Steel Corporation stockholders' equity |
|
11,004 |
|
10,218 |
|
Noncontrolling interests |
|
93 |
|
93 |
|
|
Total liabilities and stockholders' equity |
$ |
20,395 |
$ |
19,458 |
UNITED STATES STEEL CORPORATION |
|||||||||||||||||||||
NON-GAAP FINANCIAL MEASURES |
|||||||||||||||||||||
RECONCILIATION OF ADJUSTED NET EARNINGS |
|||||||||||||||||||||
|
|
Three Months Ended
|
Nine Months Ended
|
||||||||||||||||||
(In millions of dollars) |
2023 |
2022 |
2023 |
2022 |
|||||||||||||||||
Net earnings and diluted net earnings per share attributable to United States Steel Corporation, as reported |
$ |
299 |
|
$ |
1.20 |
$ |
490 |
|
$ |
1.85 |
$ |
975 |
|
$ |
3.86 |
$ |
2,350 |
|
$ |
8.38 |
|
|
Restructuring and other charges |
|
18 |
|
|
|
23 |
|
|
|
21 |
|
|
|
57 |
|
|
||||
|
Stock-based compensation expense (a) |
|
14 |
|
|
|
13 |
|
|
|
37 |
|
|
|
45 |
|
|
||||
|
VEBA asset surplus adjustment |
|
(6 |
) |
|
|
— |
|
|
|
(36 |
) |
|
|
— |
|
|
||||
|
Asset impairment charges |
|
— |
|
|
|
— |
|
|
|
4 |
|
|
|
157 |
|
|
||||
|
Environmental remediation charges |
|
9 |
|
|
|
13 |
|
|
|
11 |
|
|
|
13 |
|
|
||||
|
Debt extinguishment |
|
— |
|
|
|
(2 |
) |
|
|
— |
|
|
|
(2 |
) |
|
||||
|
Strategic alternatives review process costs |
|
16 |
|
|
|
— |
|
|
|
16 |
|
|
|
— |
|
|
||||
|
Granite City idling costs |
|
14 |
|
|
|
— |
|
|
|
14 |
|
|
|
— |
|
|
||||
|
Other charges, net |
|
1 |
|
|
|
— |
|
|
|
2 |
|
|
|
(2 |
) |
|
||||
Adjusted pre-tax net earnings to United States Steel Corporation |
|
365 |
|
|
|
537 |
|
|
|
1,044 |
|
|
|
2,618 |
|
|
|||||
|
Tax impact of adjusted items (b) |
|
(15 |
) |
|
|
(11 |
) |
|
|
(16 |
) |
|
|
(66 |
) |
|
||||
Adjusted net earnings and diluted net earnings per share attributable to United States Steel Corporation |
$ |
350 |
|
$ |
1.40 |
$ |
526 |
|
$ |
1.98 |
$ |
1,028 |
|
$ |
4.07 |
$ |
2,552 |
|
$ |
9.06 |
|
Weight average diluted ordinary shares outstanding, in millions |
|
253.1 |
|
|
|
266.3 |
|
|
|
255.1 |
|
|
|
281.6 |
|
|
|||||
(a) The prior year was retroactively adjusted to reflect the reclassification of stock-based compensation expense. The adjustment was $10 million, $28 million, $10 million and $34 million, net of taxes, for the three and nine months ended September 30, 2023, and 2022, respectively. |
|||||||||||||||||||||
(b) The tax impact of adjusted items for the three months and nine months ended September 30, 2023, is calculated using a blended tax rate of 24% for domestic items and 21% for USSE items. The tax impact of adjusted items for the three and nine months ended September 30, 2022, was calculated using a blended tax rate of 25% for domestic items and 21% for USSE items. |
|||||||||||||||||||||
UNITED STATES STEEL CORPORATION |
|||||||||||||
NON-GAAP FINANCIAL MEASURES |
|||||||||||||
RECONCILIATION OF ADJUSTED EBITDA |
|||||||||||||
|
|
Three Months Ended
|
Nine Months Ended
|
||||||||||
(Dollars in millions) |
|
2023 |
|
|
2022 |
|
|
2023 |
|
|
2022 |
|
|
Reconciliation to Adjusted EBITDA |
|
|
|
|
|||||||||
|
Net earnings attributable to United States Steel Corporation |
$ |
299 |
|
$ |
490 |
|
$ |
975 |
|
$ |
2,350 |
|
|
Income tax expense |
|
42 |
|
|
154 |
|
|
237 |
|
|
684 |
|
|
Net interest and other financial benefits |
|
(64 |
) |
|
(30 |
) |
|
(182 |
) |
|
(48 |
) |
|
Depreciation, depletion and amortization expense |
|
230 |
|
|
198 |
|
|
675 |
|
|
594 |
|
EBITDA |
|
507 |
|
|
812 |
|
|
1,705 |
|
|
3,580 |
|
|
|
Restructuring and other charges |
|
18 |
|
|
23 |
|
|
21 |
|
|
57 |
|
|
Stock-based compensation expense (a) |
|
14 |
|
|
13 |
|
|
37 |
|
|
45 |
|
|
Asset impairment charges |
|
— |
|
|
— |
|
|
4 |
|
|
157 |
|
|
Environmental remediation charges |
|
9 |
|
|
13 |
|
|
11 |
|
|
13 |
|
|
Strategic alternatives review process costs |
|
16 |
|
|
— |
|
|
16 |
|
|
— |
|
|
Granite City idling costs |
|
14 |
|
|
— |
|
|
14 |
|
|
— |
|
|
Other charges, net |
|
— |
|
|
— |
|
|
1 |
|
|
(2 |
) |
Adjusted EBITDA |
$ |
578 |
|
$ |
861 |
|
$ |
1,809 |
|
$ |
3,850 |
|
|
|
Net earnings margin (b) |
|
6.7 |
% |
|
9.4 |
% |
|
7.0 |
% |
|
14.0 |
% |
|
Adjusted EBITDA margin (b) |
|
13.0 |
% |
|
16.5 |
% |
|
13.0 |
% |
|
23.0 |
% |
(a) The prior year was retroactively adjusted to reflect the reclassification of stock-based compensation expense. |
|||||||||||||
(b) The net earnings and adjusted EBITDA margins represent net earnings or adjusted EBITDA divided by net sales. |
|||||||||||||
UNITED STATES STEEL CORPORATION |
|||||||||||||||
NON-GAAP FINANCIAL MEASURES |
|||||||||||||||
RECONCILIATION OF PAST TWELVE MONTHS OF FREE AND INVESTABLE CASH FLOW |
|||||||||||||||
|
4th |
1st |
2nd |
3rd |
|
||||||||||
|
Quarter |
Quarter |
Quarter |
Quarter |
Total of the |
||||||||||
(Dollars in millions) |
|
2022 |
|
|
2023 |
|
|
2023 |
|
|
2023 |
|
Four Quarters |
||
Net cash provided by operating activities |
$ |
755 |
|
$ |
181 |
|
$ |
713 |
|
$ |
817 |
|
$ |
2,466 |
|
Net cash used in investing activities |
|
(614 |
) |
|
(738 |
) |
|
(612 |
) |
|
(585 |
) |
|
(2,549 |
) |
Free cash flow |
|
141 |
|
|
(557 |
) |
|
101 |
|
|
232 |
|
|
(83 |
) |
Strategic capital expenditures |
|
479 |
|
|
565 |
|
|
476 |
|
|
423 |
|
|
1,943 |
|
Investable free cash flow |
$ |
620 |
|
$ |
8 |
|
$ |
577 |
|
$ |
655 |
|
$ |
1,860 |
|
We present adjusted net earnings, adjusted net earnings per diluted share, earnings before interest, income taxes, depreciation and amortization (EBITDA), adjusted EBITDA and adjusted EBITDA margin, which are non-GAAP measures, as additional measurements to enhance the understanding of our operating performance. We believe that EBITDA, considered along with net earnings, is a relevant indicator of trends relating to our operating performance and provides management and investors with additional information for comparison of our operating results to the operating results of other companies.
Adjusted net earnings and adjusted net earnings per diluted share are non-GAAP measures that exclude the effects of items that include: restructuring and other charges, stock-based compensation expense, VEBA asset surplus adjustment, asset impairment charges, environmental remediation charges, debt extinguishment, strategic alternatives review process costs, Granite City idling costs, tax impact of adjusted items and other charges, net (Adjustment Items). Adjusted EBITDA is also a non-GAAP measure that excludes the effects of certain Adjustment Items. We present adjusted net earnings, adjusted net earnings per diluted share and adjusted EBITDA to enhance the understanding of our ongoing operating performance and established trends affecting our core operations by excluding the effects of events that can obscure underlying trends. U. S. Steel's management considers adjusted net earnings, adjusted net earnings per diluted share and adjusted EBITDA as alternative measures of operating performance and not alternative measures of the Company's liquidity. U. S. Steel’s management considers adjusted net earnings, adjusted net earnings per diluted share and adjusted EBITDA useful to investors by facilitating a comparison of our operating performance to the operating performance of our competitors. Additionally, the presentation of adjusted net earnings, adjusted net earnings per diluted share and adjusted EBITDA provides insight into management’s view and assessment of the Company’s ongoing operating performance because management does not consider the Adjustment Items when evaluating the Company’s financial performance. Adjusted net earnings, adjusted net earnings per diluted share and adjusted EBITDA should not be considered a substitute for net earnings, earnings per diluted share or other financial measures as computed in accordance with U.S. GAAP and is not necessarily comparable to similarly titled measures used by other companies.
We also present free cash flow, a non-GAAP measure of cash generated from operations after any investing activity and investable free cash flow, a non-GAAP measure of cash generated from operations, after any investing activity adjusted for strategic capital expenditures. We believe that free cash flow and investable free cash flow provides further insight into the Company's overall utilization of cash. A condensed consolidated statement of operations (unaudited), condensed consolidated cash flow statement (unaudited), condensed consolidated balance sheet (unaudited) and preliminary supplemental statistics (unaudited) for U. S. Steel are attached.
CAUTIONARY NOTE REGARDING FORWARD-LOOKING STATEMENTS
This release contains information that may constitute “forward-looking statements” within the meaning of Section 27A of the Securities Act of 1933, as amended, and Section 21E of the Securities Exchange Act of 1934, as amended. We intend the forward-looking statements to be covered by the safe harbor provisions for forward-looking statements in those sections. Generally, we have identified such forward-looking statements by using the words “believe,” “expect,” “intend,” “estimate,” “anticipate,” “project,” “target,” “forecast,” “aim,” “should,” “plan,” “goal,” “future,” “will,” “may,” and similar expressions or by using future dates in connection with any discussion of, among other things, the construction or operation of new or existing facilities or operating capabilities, the timing, size and form of share repurchase transactions, operating or financial performance, trends, events or developments that we expect or anticipate will occur in the future, statements relating to volume changes, share of sales and earnings per share changes, anticipated cost savings, potential capital and operational cash improvements, changes in the global economic environment, including supply and demand conditions, inflation, interest rates, supply chain disruptions and changes in prices for our products, international trade duties and other aspects of international trade policy, statements regarding our future strategies, products and innovations, statements regarding our greenhouse gas emissions reduction goals, statements regarding existing or new regulations and statements expressing general views about future operating results. However, the absence of these words or similar expressions does not mean that a statement is not forward-looking. Forward-looking statements include all statements that are not historical facts, but instead represent only the Company’s beliefs regarding goals, plans and expectations about our prospects for the future and other future events, many of which, by their nature, are inherently uncertain, qualified by important factors and outside of the Company’s control. It is possible that the Company’s actual results and financial condition may differ, possibly materially, from the anticipated results and financial condition indicated in these forward-looking statements. Management believes that these forward-looking statements are reasonable as of the time made. However, caution should be taken not to place undue reliance on any such forward-looking statements because such statements speak only as of the date when made. Our Company undertakes no obligation to publicly update or revise any forward-looking statements, whether as a result of new information, future events or otherwise, except as required by law. In addition, forward-looking statements are subject to certain risks and uncertainties that could cause actual results to differ materially from our Company's historical experience and our present expectations or projections. These risks and uncertainties include, but are not limited to, whether the objectives of the Company's previously announced strategic alternatives review process will be achieved; the terms, structure, timing, benefits and costs of any strategic transaction; and whether any such transaction will be consummated at all; the risk that the strategic alternatives review process and its announcement could have an adverse effect on the ability of the Company to retain customers and retain and hire key personnel and maintain relationships with customers, suppliers, employees, shareholders and other business relationships and on its operating results and business generally; the risk that the strategic alternatives review process could divert the attention and time of the Company’s management, the risk of any unexpected costs or expenses resulting from the strategic alternatives review process; the risk of any litigation relating to the strategic alternatives review process; and the risks and uncertainties described in “Item 1A. Risk Factors” in our Annual report on Form 10-K for the year ended December 31, 2022 and those described from time to time in our future reports filed with the Securities and Exchange Commission.
References to (i) “U. S. Steel,” “the Company,” “we,” “us,” and “our” refer to United States Steel Corporation and its consolidated subsidiaries unless otherwise indicated by the context and (ii) “Big River Steel” refer to Big River Steel Holdings LLC and its direct and indirect subsidiaries unless otherwise indicated by the context.
Founded in 1901, United States Steel Corporation is a leading steel producer. With an unwavering focus on safety, the Company’s customer-centric Best for All® strategy is advancing a more secure, sustainable future for U. S. Steel and its stakeholders. With a renewed emphasis on innovation, U. S. Steel serves the automotive, construction, appliance, energy, containers, and packaging industries with high value-added steel products such as U. S. Steel’s proprietary XG3® advanced high-strength steel. The Company also maintains competitively advantaged iron ore production and has an annual raw steelmaking capability of 22.4 million net tons. U. S. Steel is headquartered in Pittsburgh, Pennsylvania, with world-class operations across the United States and in Central Europe. For more information, please visit www.ussteel.com.
View source version on businesswire.com: https://www.businesswire.com/news/home/20231026322773/en/
Contacts
Corporate Communications
T - (412) 433-1300
E - media@uss.com
Emily Chieng
Investor Relations Officer
T - (412) 618-9554
E - ecchieng@uss.com


