Gorman-Rupp (NYSE: GRC) manufactures and sells pumps globally. fell short of the market’s revenue expectations in Q3 CY2025 as sales rose 2.8% year on year to $172.8 million. Its non-GAAP profit of $0.52 per share was 8% below analysts’ consensus estimates.
Is now the time to buy Gorman-Rupp? Find out by accessing our full research report, it’s free for active Edge members.
Gorman-Rupp (GRC) Q3 CY2025 Highlights:
- Revenue: $172.8 million vs analyst estimates of $174.6 million (2.8% year-on-year growth, 1% miss)
- Adjusted EPS: $0.52 vs analyst expectations of $0.57 (8% miss)
- Adjusted EBITDA: $32.3 million vs analyst estimates of $31.54 million (18.7% margin, 2.4% beat)
- Operating Margin: 12.4%, down from 13.9% in the same quarter last year
- Free Cash Flow Margin: 20.7%, up from 14.3% in the same quarter last year
- Backlog: $234.2 million at quarter end, up 12.7% year on year
- Market Capitalization: $1.29 billion
Scott A. King, President and CEO, commented, “During the quarter we made the decision to close two of our smaller facilities that primarily served the agriculture market and to transition a third facility to support both the expansion of our data center driven HVAC business and continued growth in the municipal and fire markets. While it is always a difficult decision to close facilities, we believe these actions will improve profitability by reducing fixed costs while also supporting our higher growth markets. Although our gross margin has decreased slightly from our record levels due to the timing of price increases versus the timing of tariff expenses, we expect to be able to maintain our margin rates over the long-term by monitoring the impact of tariffs and taking appropriate pricing actions. Cash flow continued to be strong during the quarter resulting in an additional reduction in debt, bringing the total reduction through the first three quarters of 2025 to $45 million, thereby further improving interest expense. We continued to see strong incoming orders during the quarter across the majority of our markets with year-to-date incoming orders now up over 10% from the same period last year. As a result of these strong incoming orders, our backlog has continued to increase and positions us well for the balance of 2025 and into 2026.”
Company Overview
Powering fluid dynamics since 1934, Gorman-Rupp (NYSE: GRC) has evolved from its Ohio origins into a global manufacturer and seller of pumps and pump systems.
Revenue Growth
A company’s long-term performance is an indicator of its overall quality. Any business can have short-term success, but a top-tier one grows for years. Luckily, Gorman-Rupp’s sales grew at an exceptional 13.5% compounded annual growth rate over the last five years. Its growth beat the average industrials company and shows its offerings resonate with customers, a helpful starting point for our analysis.
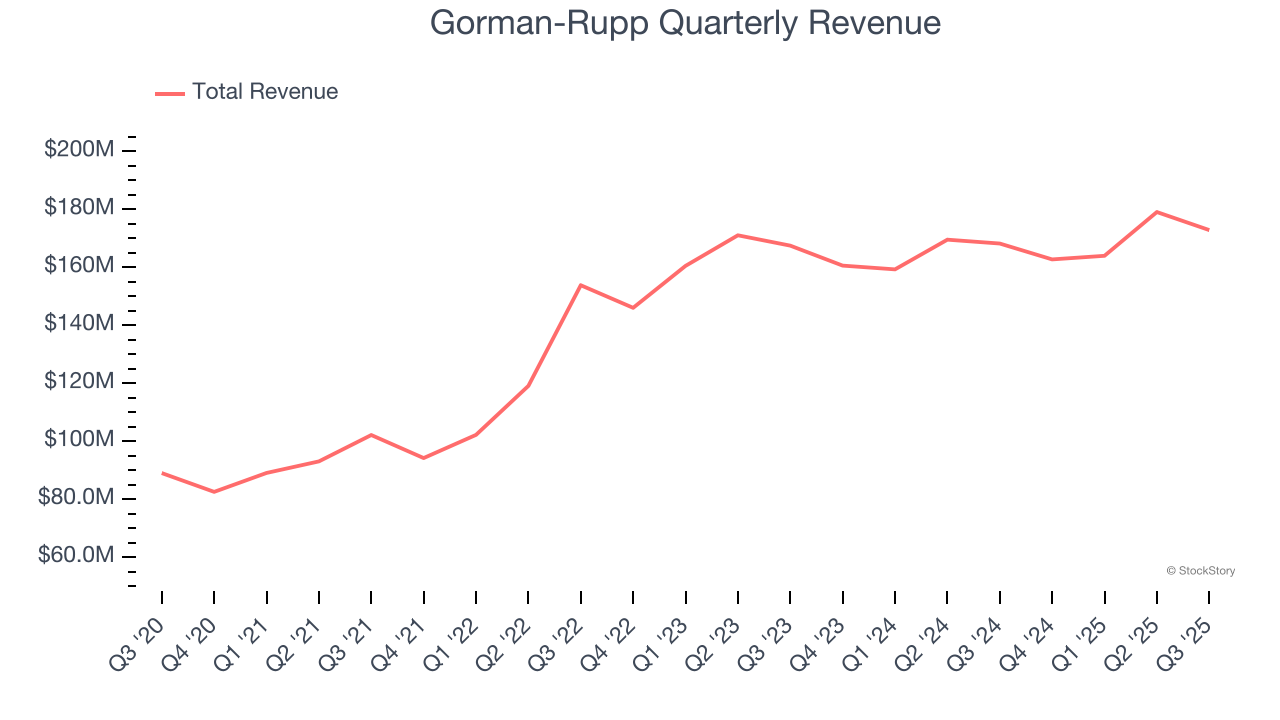
We at StockStory place the most emphasis on long-term growth, but within industrials, a half-decade historical view may miss cycles, industry trends, or a company capitalizing on catalysts such as a new contract win or a successful product line. Gorman-Rupp’s recent performance shows its demand has slowed significantly as its annualized revenue growth of 2.6% over the last two years was well below its five-year trend. 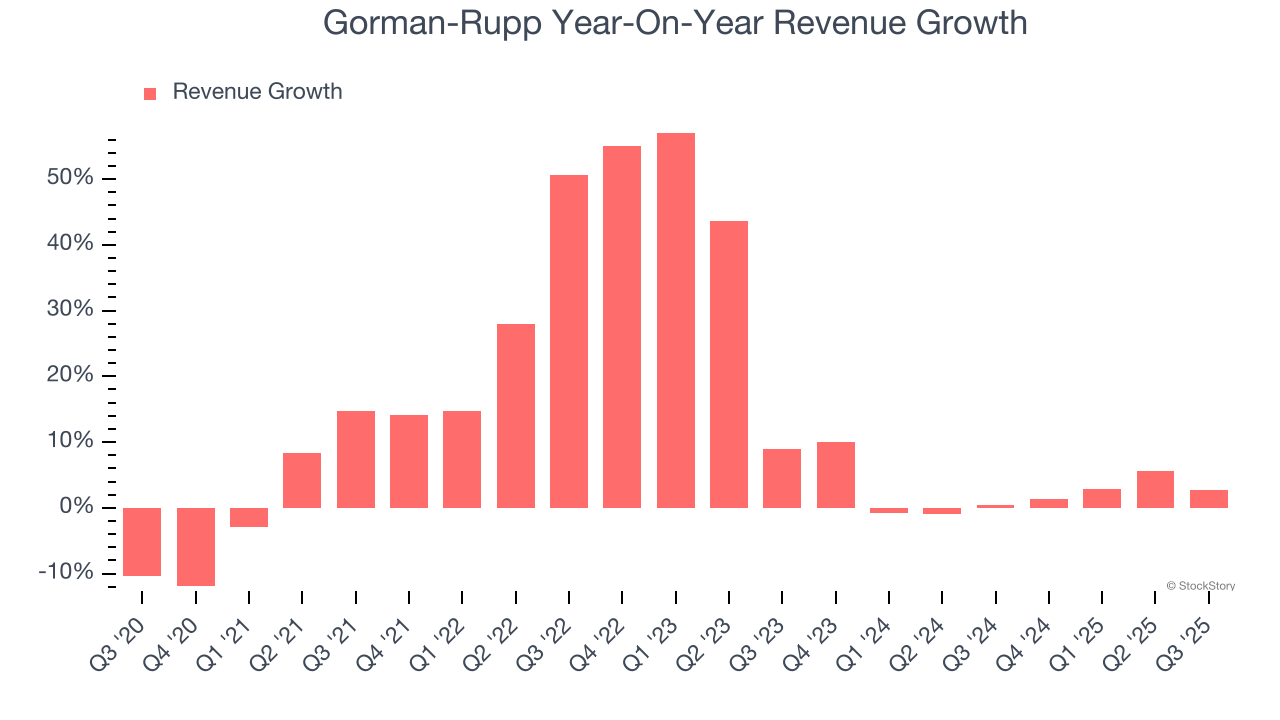
We can dig further into the company’s revenue dynamics by analyzing its backlog, or the value of its outstanding orders that have not yet been executed or delivered. Gorman-Rupp’s backlog reached $234.2 million in the latest quarter and averaged 12.7% year-on-year growth over the last two years. Because this number is better than its revenue growth, we can see the company accumulated more orders than it could fulfill and deferred revenue to the future. This could imply elevated demand for Gorman-Rupp’s products and services but raises concerns about capacity constraints. 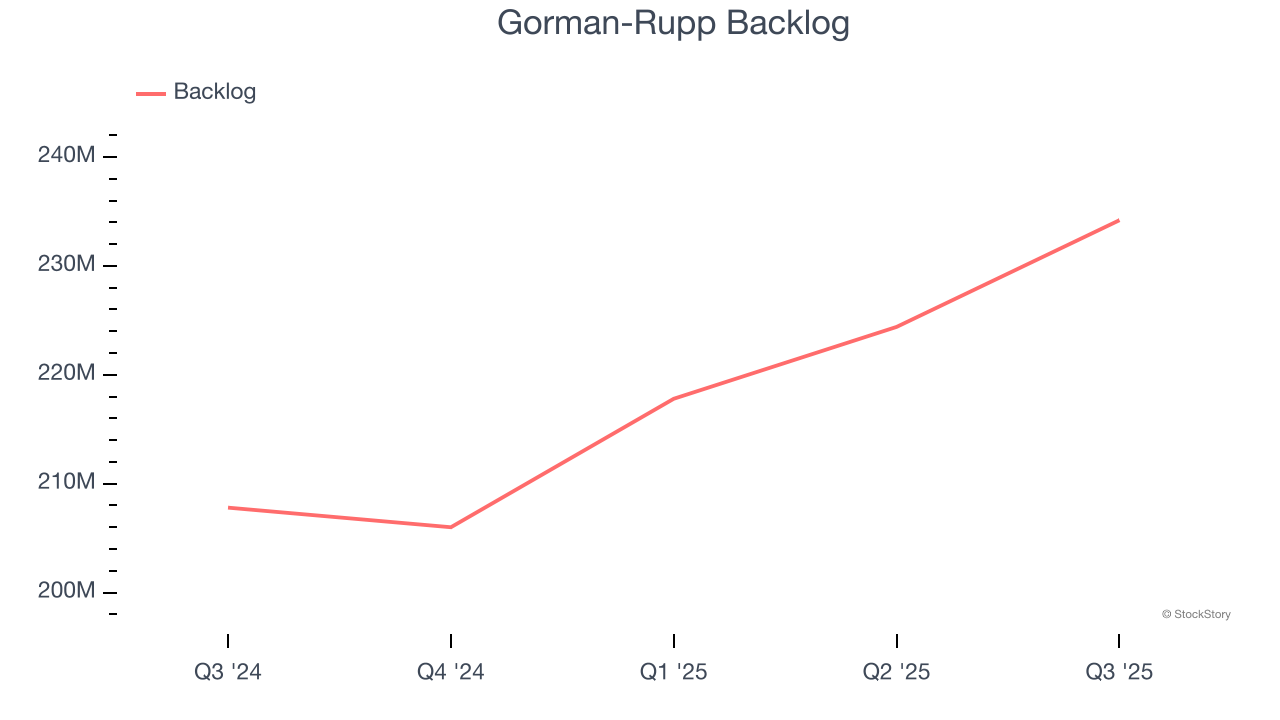
This quarter, Gorman-Rupp’s revenue grew by 2.8% year on year to $172.8 million, falling short of Wall Street’s estimates.
Looking ahead, sell-side analysts expect revenue to grow 4.7% over the next 12 months. Although this projection indicates its newer products and services will fuel better top-line performance, it is still below average for the sector. At least the company is tracking well in other measures of financial health.
Software is eating the world and there is virtually no industry left that has been untouched by it. That drives increasing demand for tools helping software developers do their jobs, whether it be monitoring critical cloud infrastructure, integrating audio and video functionality, or ensuring smooth content streaming. Click here to access a free report on our 3 favorite stocks to play this generational megatrend.
Operating Margin
Gorman-Rupp has been an efficient company over the last five years. It was one of the more profitable businesses in the industrials sector, boasting an average operating margin of 12%. This result was particularly impressive because of its low gross margin, which is mostly a factor of what it sells and takes huge shifts to move meaningfully. Companies have more control over their operating margins, and it’s a show of well-managed operations if they’re high when gross margins are low.
Looking at the trend in its profitability, Gorman-Rupp’s operating margin rose by 3.3 percentage points over the last five years, as its sales growth gave it operating leverage.
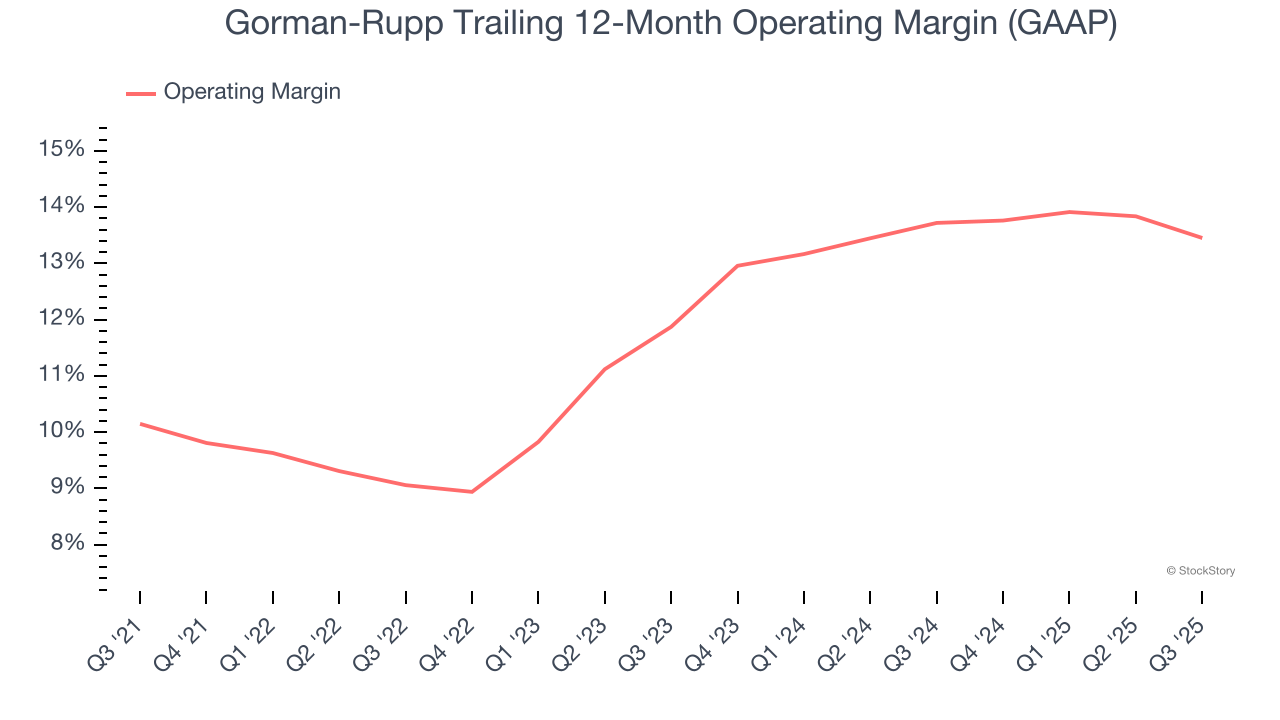
In Q3, Gorman-Rupp generated an operating margin profit margin of 12.4%, down 1.5 percentage points year on year. Since Gorman-Rupp’s gross margin decreased more than its operating margin, we can assume its recent inefficiencies were driven more by weaker leverage on its cost of sales rather than increased marketing, R&D, and administrative overhead expenses.
Earnings Per Share
We track the long-term change in earnings per share (EPS) for the same reason as long-term revenue growth. Compared to revenue, however, EPS highlights whether a company’s growth is profitable.
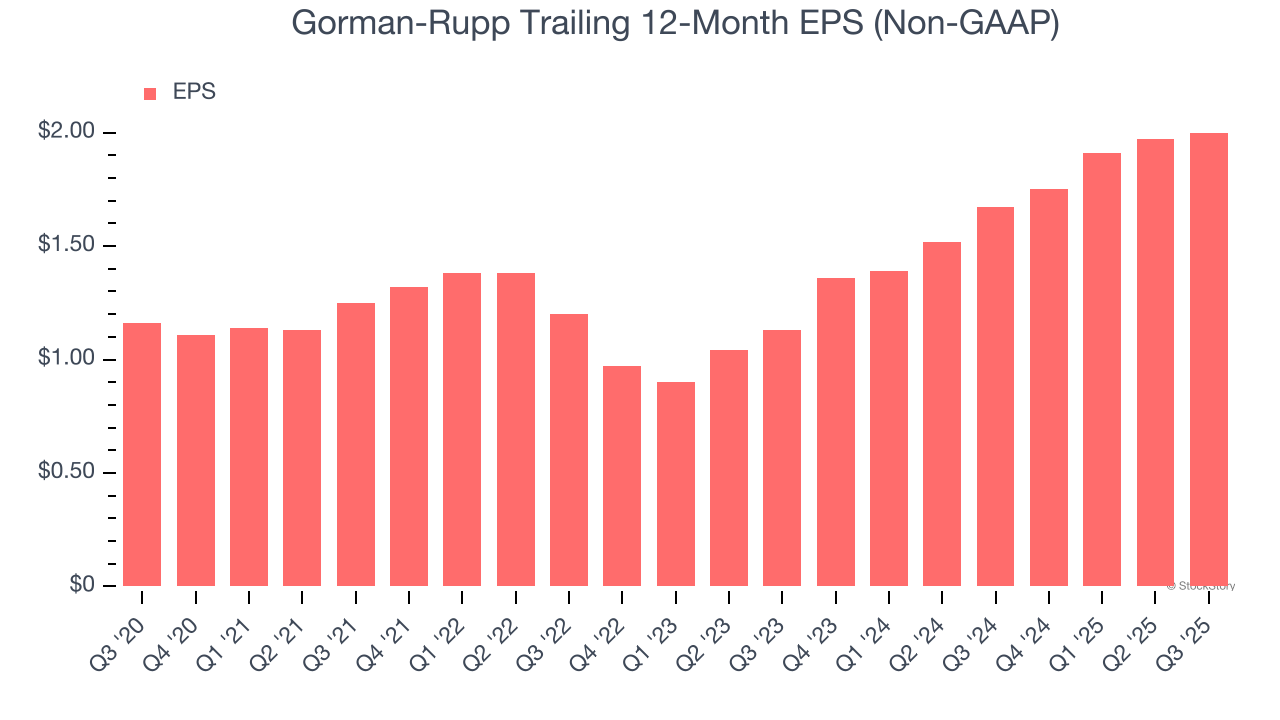
Gorman-Rupp’s solid 11.5% annual EPS growth over the last five years aligns with its revenue performance. This tells us its incremental sales were profitable.
Like with revenue, we analyze EPS over a more recent period because it can provide insight into an emerging theme or development for the business.
For Gorman-Rupp, its two-year annual EPS growth of 33% was higher than its five-year trend. We love it when earnings growth accelerates, especially when it accelerates off an already high base.
In Q3, Gorman-Rupp reported adjusted EPS of $0.52, up from $0.49 in the same quarter last year. Despite growing year on year, this print missed analysts’ estimates, but we care more about long-term adjusted EPS growth than short-term movements. Over the next 12 months, Wall Street expects Gorman-Rupp’s full-year EPS of $2 to grow 18%.
Key Takeaways from Gorman-Rupp’s Q3 Results
It was encouraging to see Gorman-Rupp beat analysts’ EBITDA expectations this quarter. On the other hand, its EPS missed and its revenue fell slightly short of Wall Street’s estimates. Overall, this was a weaker quarter. The stock traded up 1.8% to $49.96 immediately following the results.
So should you invest in Gorman-Rupp right now? What happened in the latest quarter matters, but not as much as longer-term business quality and valuation, when deciding whether to invest in this stock. We cover that in our actionable full research report which you can read here, it’s free for active Edge members.