


Electronics manufacturing services provider Benchmark (NYSE: BHE) reported Q3 CY2025 results beating Wall Street’s revenue expectations, with sales up 3.5% year on year to $680.7 million. The company expects next quarter’s revenue to be around $695 million, close to analysts’ estimates. Its non-GAAP profit of $0.62 per share was 8.1% above analysts’ consensus estimates.
Is now the time to buy Benchmark? Find out by accessing our full research report, it’s free for active Edge members.
Benchmark (BHE) Q3 CY2025 Highlights:
- Revenue: $680.7 million vs analyst estimates of $661.7 million (3.5% year-on-year growth, 2.9% beat)
- Adjusted EPS: $0.62 vs analyst estimates of $0.57 (8.1% beat)
- Adjusted EBITDA: $35.51 million (5.2% margin, 16% year-on-year decline)
- Revenue Guidance for Q4 CY2025 is $695 million at the midpoint, roughly in line with what analysts were expecting
- Adjusted EPS guidance for Q4 CY2025 is $0.65 at the midpoint, roughly in line with what analysts were expecting
- Operating Margin: 3.5%, in line with the same quarter last year
- Free Cash Flow Margin: 3.7%, similar to the same quarter last year
- Market Capitalization: $1.58 billion
“I am proud of our execution in the third quarter as we achieved the high end of our guidance for revenue and non-GAAP earnings per share,” said Jeff Benck, Benchmark’s CEO.
Company Overview
Operating as a critical behind-the-scenes partner for complex technology products since 1979, Benchmark Electronics (NYSE: BHE) provides advanced manufacturing, engineering, and technology solutions for original equipment manufacturers across aerospace, medical, industrial, and technology sectors.
Revenue Growth
A company’s long-term sales performance is one signal of its overall quality. Any business can put up a good quarter or two, but the best consistently grow over the long haul.
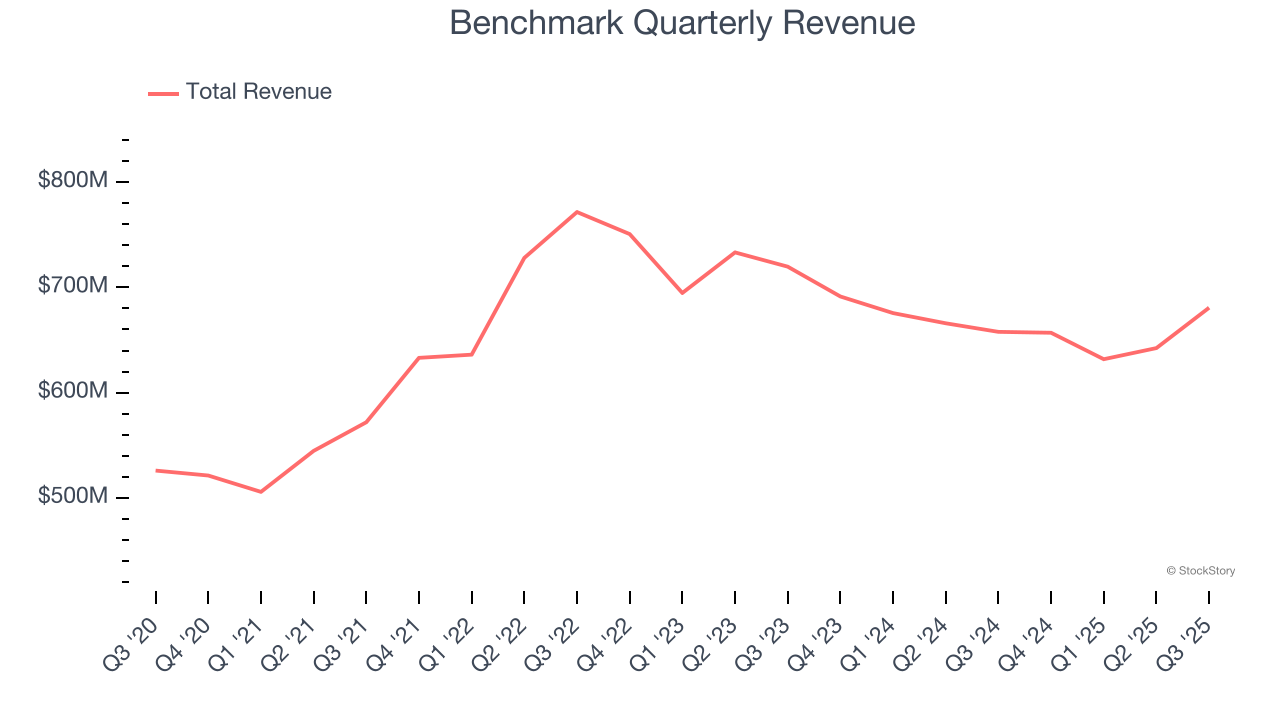
With $2.61 billion in revenue over the past 12 months, Benchmark is a mid-sized business services company, which sometimes brings disadvantages compared to larger competitors benefiting from better economies of scale. On the bright side, it can still flex high growth rates because it’s working from a smaller revenue base.
As you can see below, Benchmark’s 5.1% annualized revenue growth over the last five years was decent. This shows its offerings generated slightly more demand than the average business services company, a useful starting point for our analysis.
We at StockStory place the most emphasis on long-term growth, but within business services, a half-decade historical view may miss recent innovations or disruptive industry trends. Benchmark’s recent performance marks a sharp pivot from its five-year trend as its revenue has shown annualized declines of 5.1% over the last two years. 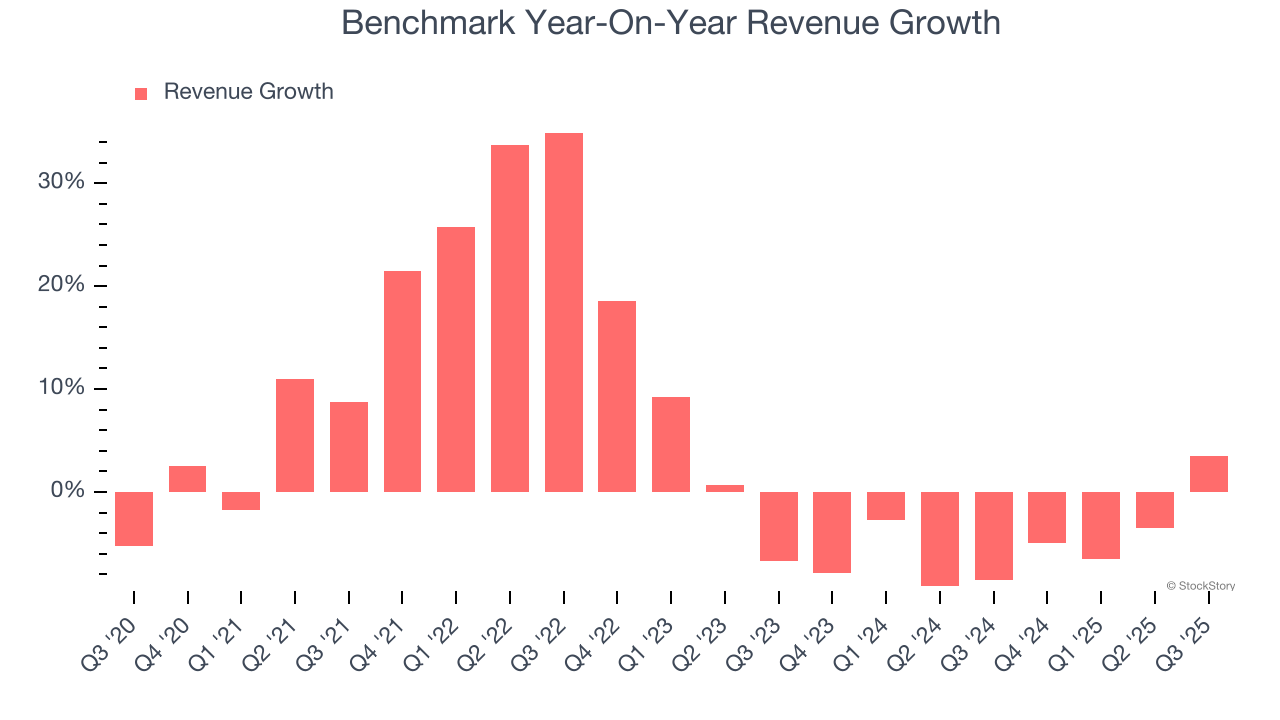
This quarter, Benchmark reported modest year-on-year revenue growth of 3.5% but beat Wall Street’s estimates by 2.9%. Company management is currently guiding for a 5.8% year-on-year increase in sales next quarter.
Looking further ahead, sell-side analysts expect revenue to grow 6.6% over the next 12 months, an improvement versus the last two years. This projection is above the sector average and suggests its newer products and services will catalyze better top-line performance.
While Wall Street chases Nvidia at all-time highs, an under-the-radar semiconductor supplier is dominating a critical AI component these giants can’t build without. Click here to access our free report one of our favorites growth stories.
Operating Margin
Operating margin is one of the best measures of profitability because it tells us how much money a company takes home after subtracting all core expenses, like marketing and R&D.
Benchmark was profitable over the last five years but held back by its large cost base. Its average operating margin of 3.7% was weak for a business services business.
On the plus side, Benchmark’s operating margin rose by 1.2 percentage points over the last five years, as its sales growth gave it operating leverage.
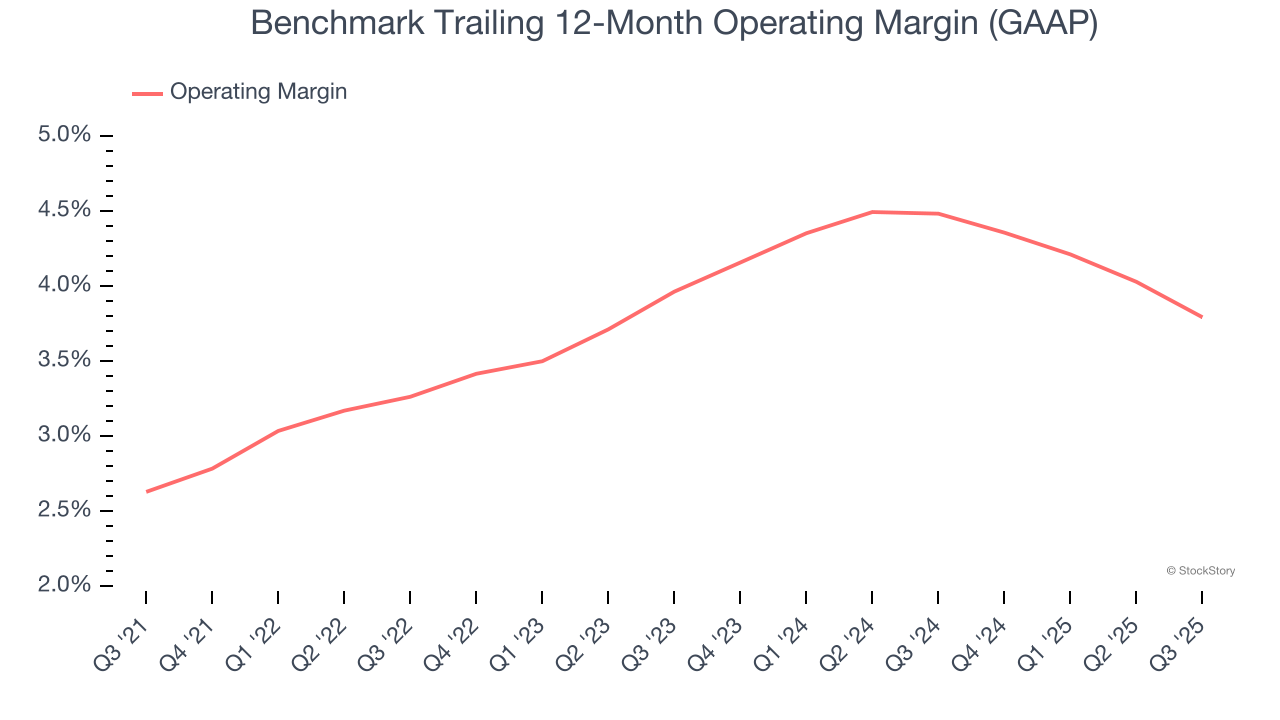
In Q3, Benchmark generated an operating margin profit margin of 3.5%, in line with the same quarter last year. This indicates the company’s overall cost structure has been relatively stable.
Earnings Per Share
We track the long-term change in earnings per share (EPS) for the same reason as long-term revenue growth. Compared to revenue, however, EPS highlights whether a company’s growth is profitable.
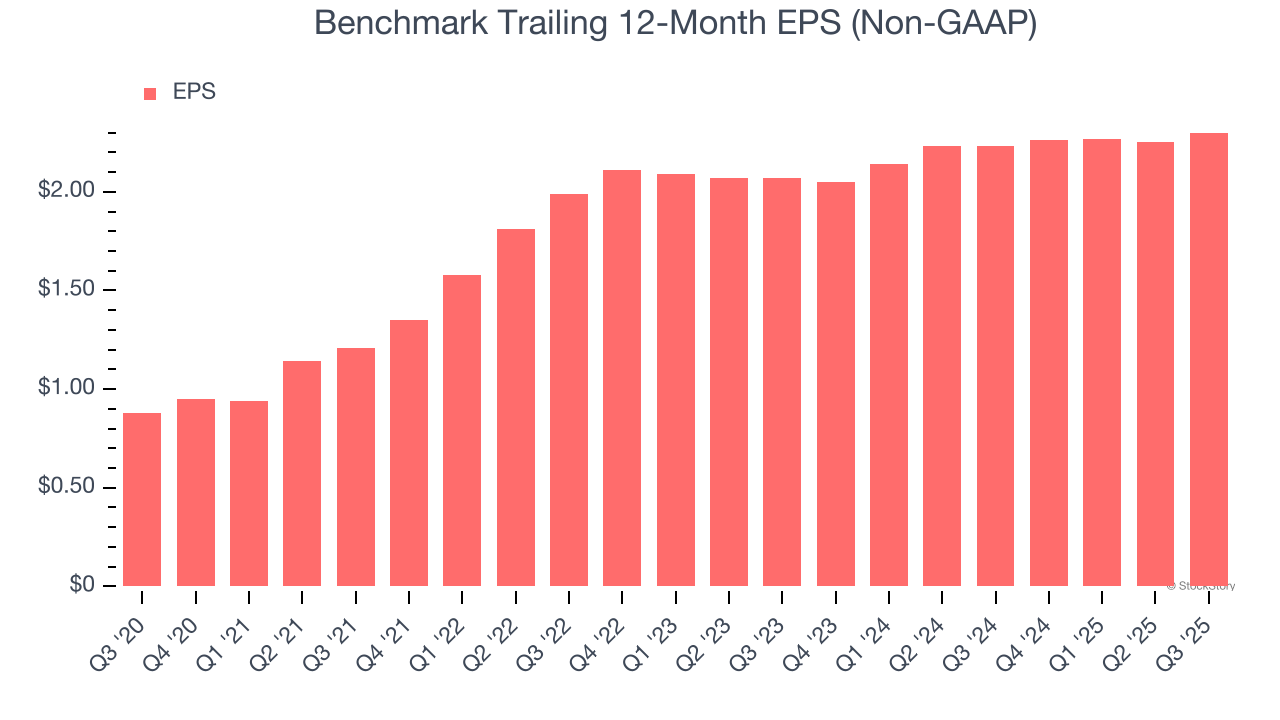
Benchmark’s EPS grew at an astounding 21.2% compounded annual growth rate over the last five years, higher than its 5.1% annualized revenue growth. This tells us the company became more profitable on a per-share basis as it expanded.
Diving into the nuances of Benchmark’s earnings can give us a better understanding of its performance. As we mentioned earlier, Benchmark’s operating margin was flat this quarter but expanded by 1.2 percentage points over the last five years. This was the most relevant factor (aside from the revenue impact) behind its higher earnings; interest expenses and taxes can also affect EPS but don’t tell us as much about a company’s fundamentals.
Like with revenue, we analyze EPS over a more recent period because it can provide insight into an emerging theme or development for the business.
For Benchmark, its two-year annual EPS growth of 5.4% was lower than its five-year trend. We hope its growth can accelerate in the future.
In Q3, Benchmark reported adjusted EPS of $0.62, up from $0.57 in the same quarter last year. This print beat analysts’ estimates by 8.1%. Over the next 12 months, Wall Street expects Benchmark’s full-year EPS of $2.30 to grow 10.2%.
Key Takeaways from Benchmark’s Q3 Results
We enjoyed seeing Benchmark beat analysts’ revenue expectations this quarter. We were also glad its EPS outperformed Wall Street’s estimates. Overall, this print had some key positives. Investors were likely hoping for more, and shares traded down 1% to $42.56 immediately following the results.
So do we think Benchmark is an attractive buy at the current price? When making that decision, it’s important to consider its valuation, business qualities, as well as what has happened in the latest quarter. We cover that in our actionable full research report which you can read here, it’s free for active Edge members.


