


Multinational media and entertainment corporation Paramount (NASDAQ: PARA) met Wall Street’s revenue expectations in Q2 CY2025, but sales were flat year on year at $6.85 billion. Its non-GAAP profit of $0.46 per share was 24.6% above analysts’ consensus estimates.
Is now the time to buy Paramount? Find out by accessing our full research report, it’s free.
Paramount (PARA) Q2 CY2025 Highlights:
- Revenue: $6.85 billion vs analyst estimates of $6.86 billion (flat year on year, in line)
- Adjusted EPS: $0.46 vs analyst estimates of $0.37 (24.6% beat)
- Adjusted EBITDA: $824 million vs analyst estimates of $749.8 million (12% margin, 9.9% beat)
- Operating Margin: 5.8%, up from -78.1% in the same quarter last year
- Free Cash Flow Margin: 1.7%, up from 0.1% in the same quarter last year
- Market Capitalization: $8.74 billion
Company Overview
Owner of Spongebob Squarepants and formerly known as ViacomCBS, Paramount Global (NASDAQ: PARA) is a major media conglomerate offering television, film production, and digital content across various global platforms.
Revenue Growth
A company’s long-term sales performance can indicate its overall quality. Even a bad business can shine for one or two quarters, but a top-tier one grows for years. Unfortunately, Paramount’s 2.3% annualized revenue growth over the last five years was weak. This was below our standards and is a rough starting point for our analysis.
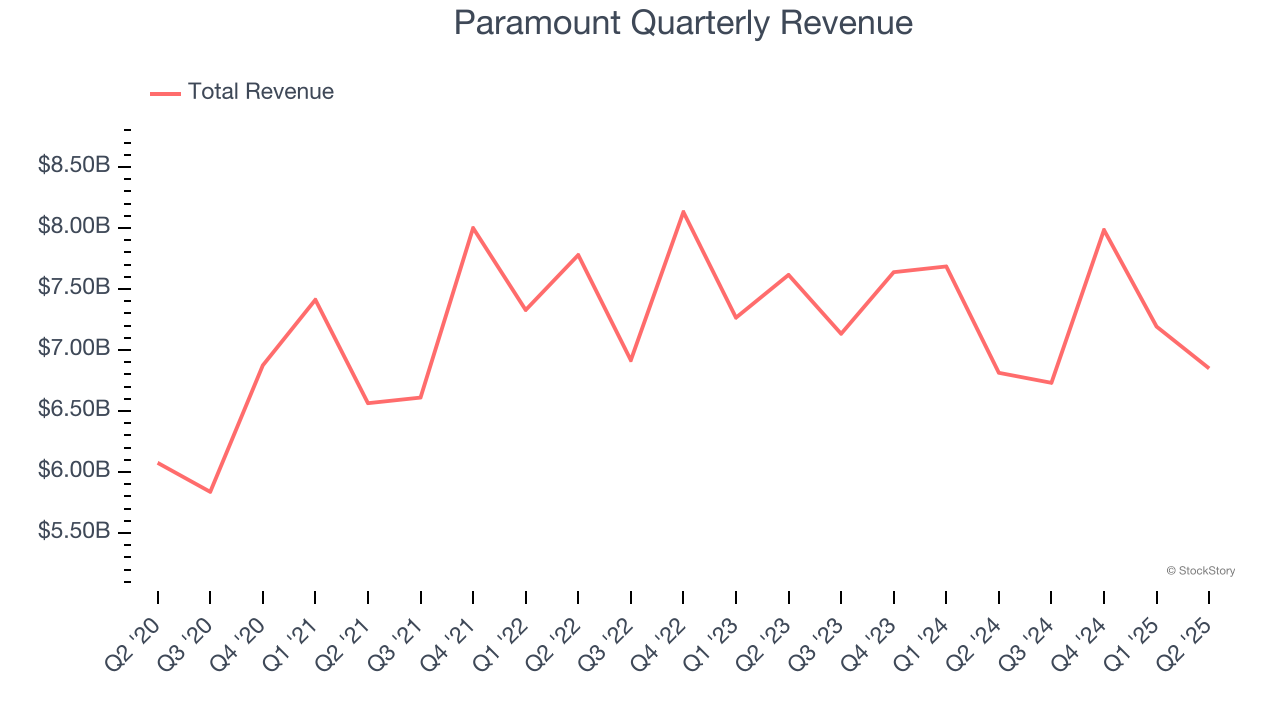
Long-term growth is the most important, but within consumer discretionary, product cycles are short and revenue can be hit-driven due to rapidly changing trends and consumer preferences. Paramount’s performance shows it grew in the past but relinquished its gains over the last two years, as its revenue fell by 2% annually. 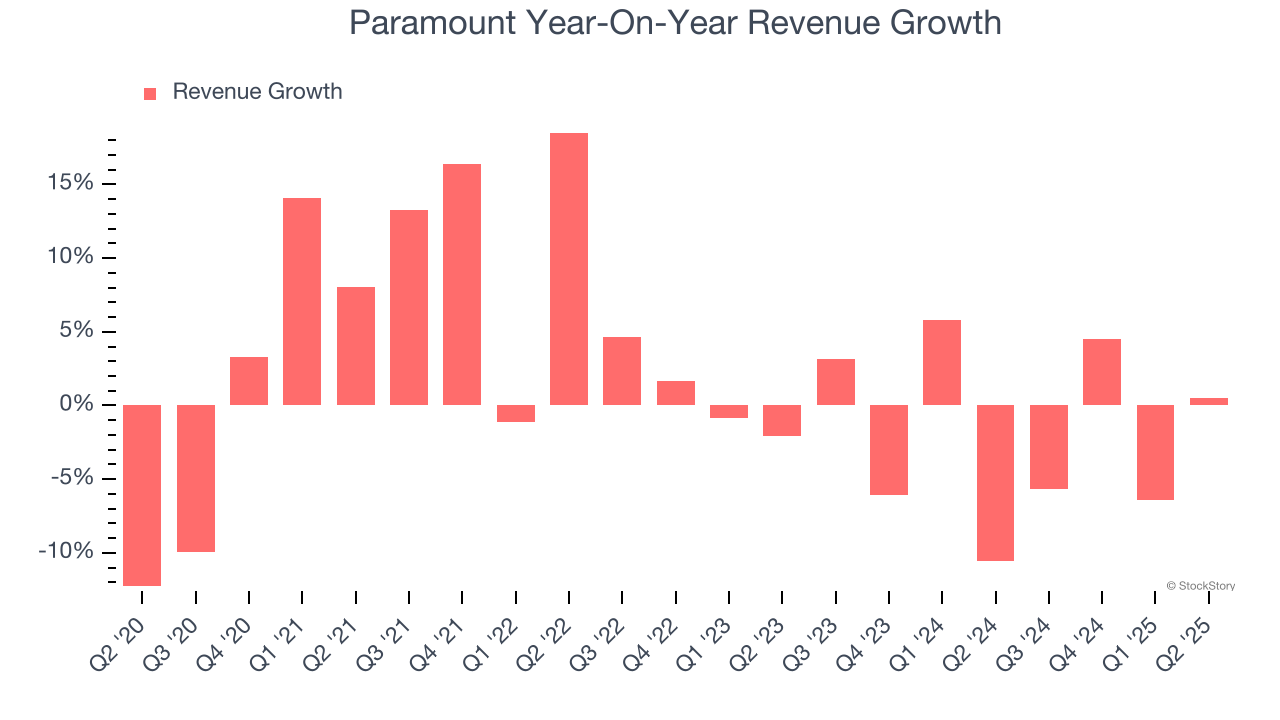
We can better understand the company’s revenue dynamics by analyzing its three most important segments: TV Media, Direct-to-Consumer, and Filmed Entertainment, which are 58.6%, 31.5%, and 10.1% of revenue. Over the last two years, Paramount’s TV Media revenue (broadcasting) averaged year-on-year declines of 8.1%. On the other hand, its Direct-to-Consumer revenue (streaming) averaged year-on-year growth of 0.8% while its Direct-to-Consumer revenue (streaming) was flat. 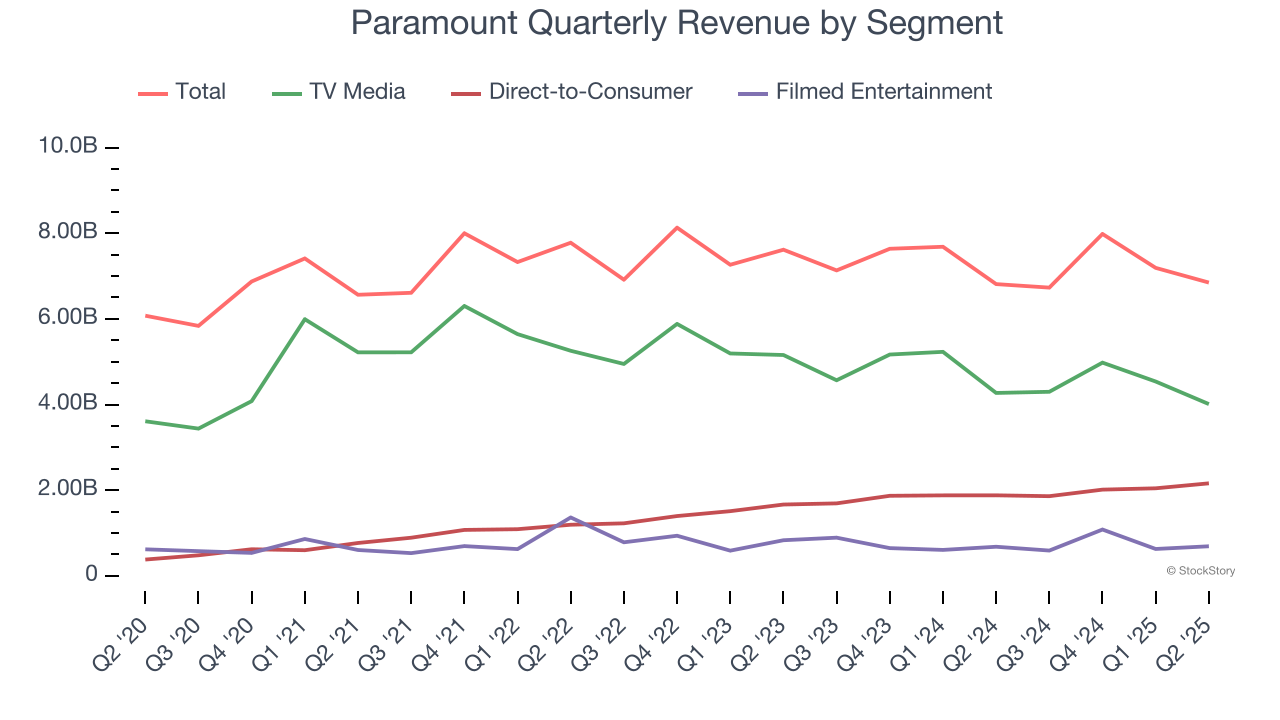
This quarter, Paramount’s $6.85 billion of revenue was flat year on year and in line with Wall Street’s estimates.
Looking ahead, sell-side analysts expect revenue to decline by 1.7% over the next 12 months, similar to its two-year rate. This projection doesn't excite us and suggests its newer products and services will not accelerate its top-line performance yet.
Today’s young investors won’t have read the timeless lessons in Gorilla Game: Picking Winners In High Technology because it was written more than 20 years ago when Microsoft and Apple were first establishing their supremacy. But if we apply the same principles, then enterprise software stocks leveraging their own generative AI capabilities may well be the Gorillas of the future. So, in that spirit, we are excited to present our Special Free Report on a profitable, fast-growing enterprise software stock that is already riding the automation wave and looking to catch the generative AI next.
Operating Margin
Paramount’s operating margin has risen over the last 12 months, but it still averaged negative 5.7% over the last two years. This is due to its large expense base and inefficient cost structure.
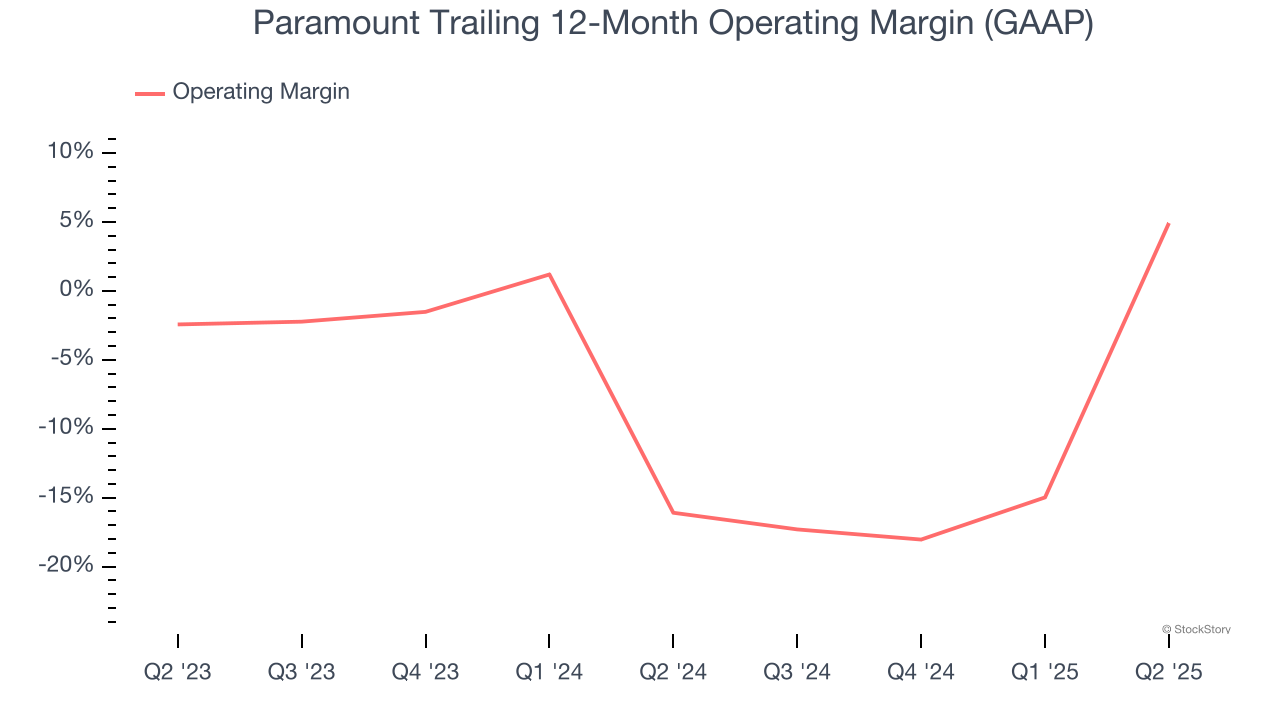
In Q2, Paramount generated an operating margin profit margin of 5.8%, up 83.9 percentage points year on year. This increase was a welcome development and shows it was more efficient.
Earnings Per Share
We track the long-term change in earnings per share (EPS) for the same reason as long-term revenue growth. Compared to revenue, however, EPS highlights whether a company’s growth is profitable.
Sadly for Paramount, its EPS declined by 23.5% annually over the last five years while its revenue grew by 2.3%. This tells us the company became less profitable on a per-share basis as it expanded.
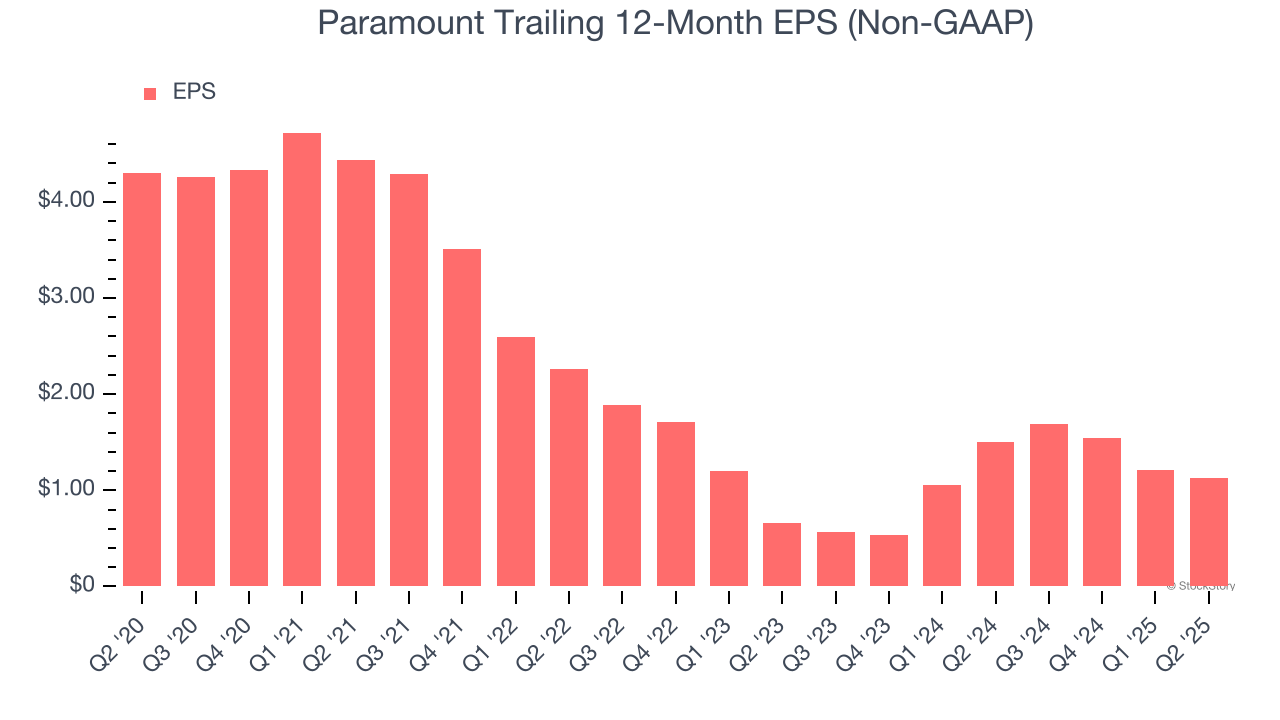
In Q2, Paramount reported adjusted EPS at $0.46, down from $0.54 in the same quarter last year. Despite falling year on year, this print easily cleared analysts’ estimates. Over the next 12 months, Wall Street expects Paramount’s full-year EPS of $1.13 to grow 19.2%.
Key Takeaways from Paramount’s Q2 Results
We enjoyed seeing Paramount beat analysts’ EPS expectations this quarter. We were also happy its EBITDA outperformed Wall Street’s estimates. On the other hand, its Direct-to-Consumer revenue missed. Overall, we think this was still a solid quarter with some key areas of upside. The stock remained flat at $12.50 immediately following the results.
Is Paramount an attractive investment opportunity at the current price? What happened in the latest quarter matters, but not as much as longer-term business quality and valuation, when deciding whether to invest in this stock. We cover that in our actionable full research report which you can read here, it’s free.


