Photo by fauxels
Originally Posted On: Foot Traffic Attribution And The Digital Marketer | Reveal Mobile
Foot Traffic Analytics – Precursor to Attribution
Foot traffic analytics is a precursor to foot traffic attribution. In order to know the impact a campaign has on real-world traffic, marketers need a baseline before the campaign takes flight. Foot traffic analytics show the volume of people who visit a physical location within a specific timeframe. It quantifies in-store visits.
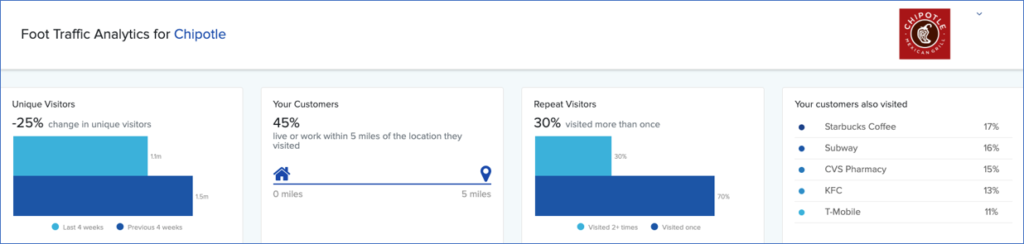
You can see in this foot traffic analytics report that Chipotle has seen a 25% decline in restaurant visits in the last four weeks. While nearly half of their diners live within five miles of the restaurant they ate at, a full 70% are one-time diners. You can also see that sizeable portion of the people who go to Chipotle also go to Subway – 16% – and KFC – 13%. There are audiences that Chipotle might want to target as part of a geoconquesting campaign.
Foot Traffic Attribution Defined
 Ties ad exposure to real-world actions.
 It quantifies the impact of digital and out-of-home advertising on in-store visits
 Who uses it?
Agencies and brands that run campaigns to drive foot traffic to physical locations
 Why is it important?
Shows ROI on ad spend and paid media
Foot traffic attribution has fundamental value because it quantifies the impact of digital and out-of-home ad spend on in-store visits.
What Does Foot Traffic Attribution Look Like?
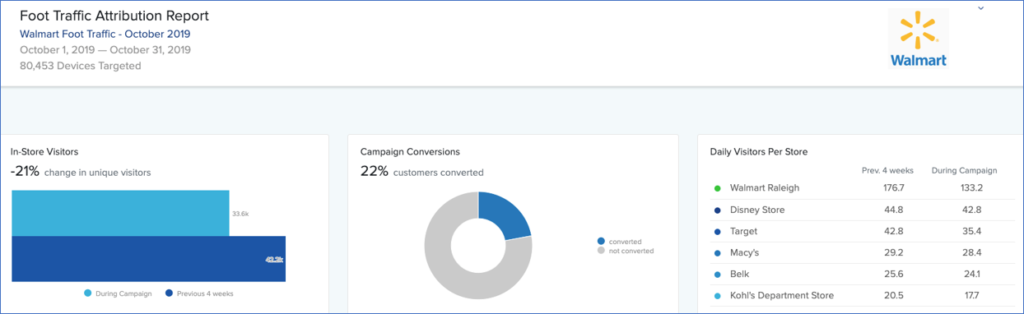
Below is an example of a foot traffic attribution report for Walmart stores in the Raleigh, NC area. The data here is a proxy for what you would see in an actual attribution report and do not reflect an actual campaign for Walmart.
The graph on the left shows the change in in-store visitors during the hypothetical campaign, comparing it to the four weeks prior. The chart in the center shows the percentage of conversions. The table on the right presents how foot traffic to Walmart, and other stores in the category, changed during the campaign period. Those stores that saw a decline in visits per store during the campaign are likely where Walmart likely got its visitors from. The largest share came from Target, and the smallest share came from Macy’s.
Why Is Attribution So Elusive?
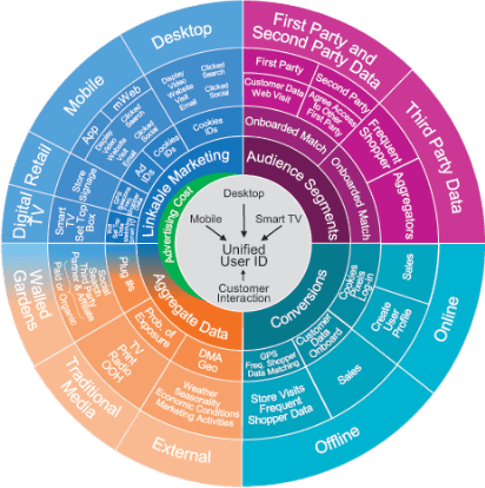 MMA Multi-Touch Attribution Data Map
Digging into why foot traffic attribution can be so hard to measure, first and foremost, there are many ways to figure it. Data tends to reside in numerous, siloed systems that are difficult to aggregate with any sense of reliability.
The Mobile Marketing Association’s Multi-Touch Attribution Data Map, at left, encompasses more than just foot traffic attribution; however, it’s indicative of the complexity marketers have to grapple with when wrestling with attribution.
On a more most straightforward level, there are three core ingredients for foot traffic attribution:
- ad, media and channel data
- audience visit data
- transaction data
However, even as simple as this seems on the surface, the devil is in the details. Foot traffic attribution can be difficult to ascertain, which we’ll solve in the coming pages.
The Attribution Continuum
There is more than one way to determine how foot traffic has been affected by an ad or a campaign. Brands and agencies have been performing attribution a long time through a variety of methods. Here we rank them on a continuum from easy to hard.
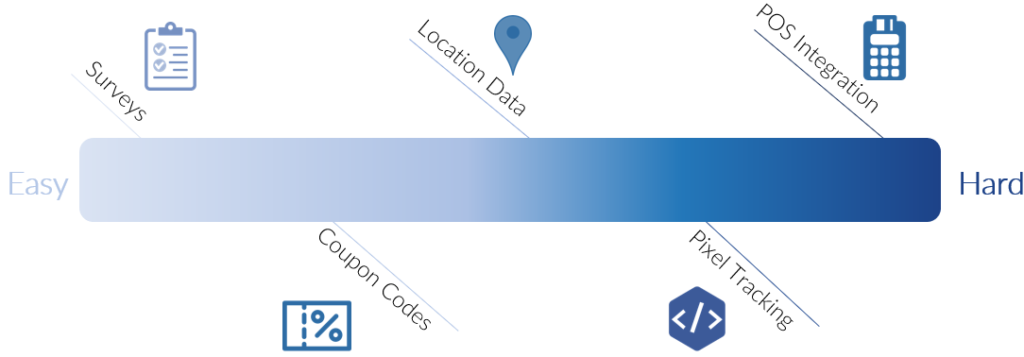
One of the easiest ways to solve for foot traffic attribution is by asking the question, “how did you hear about us?” at or after the point of sale. In addition to being easy, this also allows a marketer to determine the impact of online and offline ad channels. That said, it’s not always a reliable source data. Since most consumers don’t bother to reply to these types of surveys, the data is sparse. Moving down the easy-to-hard continuum, marketers may use coupon codes or perhaps campaign-specific phone numbers. From there, we get into location-based foot traffic attribution and pixel tracking. And at the hard end of the continuum, we have point-of-sale integration, which ties attribution together.
The LBMA’s 3-Layer Location Cake
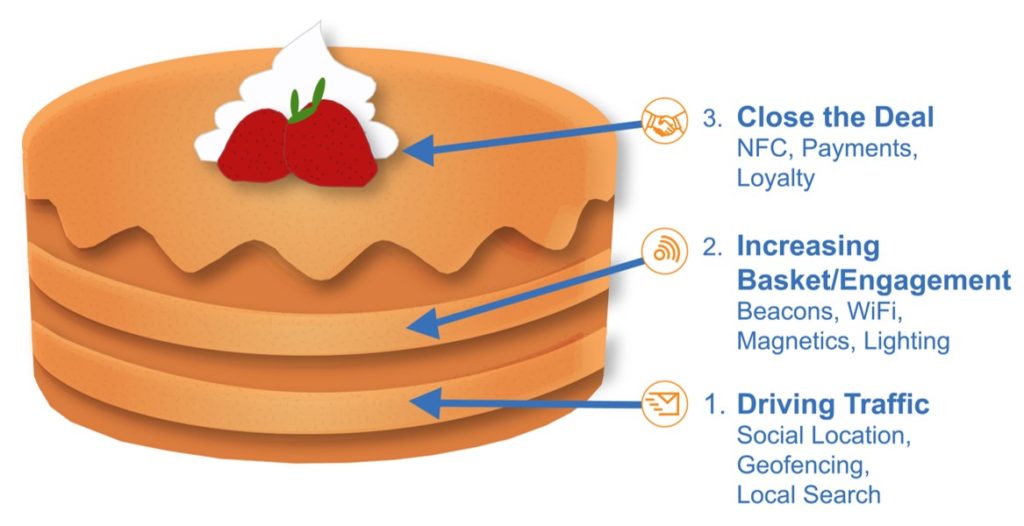 The LBMA uses a cake visual to explain how location comes into play when determining foot traffic attribution.
The bottom: “Driving Traffic” layer represents attribution at the store visit level. In other words, driving traffic to a specific location even if they didn’t buy anything.
The middle “Basket” layer relates to how the visitor is engaged while in the store. This includes dwell time, how shoppers may be enticed to buy higher value items or pay special attention to an in-store promotion.
The top layer is what happens at checkout – what the visitor actually buys and how much they actually spend. This is the hardest part of the cake to solve. Point-of-sale and transaction data requires CRMs and POS systems, loyalty management, etc. and depend upon tight integrations.
Each of these layers is supported by technology. The mortar, or perhaps the frosting (couldn’t resist), that holds all of these layers together is location data. Using location data, brands can attribute in-store visits to ads served and ultimately to sales made.
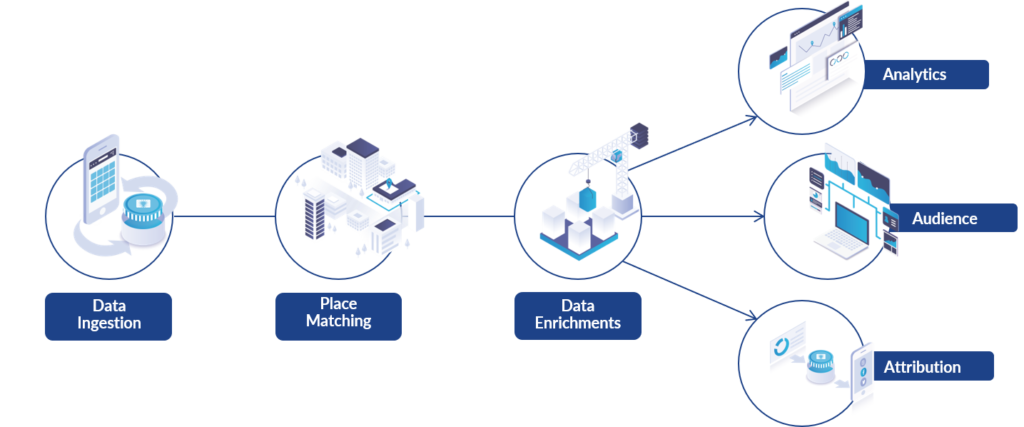
The Key to Foot Traffic AttributionPrivacy-Compliant Location Data
Foot traffic attribution starts with privacy-compliant location data — typically GPS data, which is ingested into a massive data store, aggregated and anonymized to prevent the identification of individual people and to make sure the data is clean.
Next, the location data is matched to a point of interest, which could be a retail business, a venue, a stadium, or some other place of business. This is one of the most difficult steps in the process, as it requires managing and maintaining up-to-date business information.
An optional next step is to enrich the data, appending other demographic or behavioral insights to it. This is where marketers or agencies typically bring proprietary data into the equation.
There then must be a method to allow the building of location-based audiences who can be marketed to. These audiences can be delivered via software that enables marketers to self-serve; they could be culled from a set of pre-determined locations and delivered via data feed, or they can be pre-built audiences that a marketer can choose from.
Finally, whichever method is chosen, the marketer will want to act on those audiences, serving advertising or content to them through a range of channels.
Foot Traffic Attribution Example
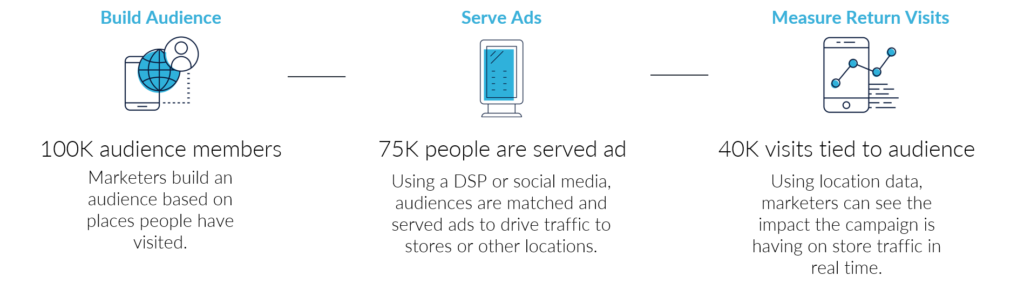
Using location data software, let’s imagine that we’ve built an audience of people who went to Chipotle in North Carolina at some point over the past three months — totaling 100,000 devices. We want to serve ads to this audience, so we upload it to Facebook using the custom audiences option. There’s a 75% match rate, meaning 75,000 people in our original audience are on Facebook. Now, our marketable audience is 75,000 people and we’re going to run ads targeting them on Facebook. During and after our ads run, we use the same audience-building software to see who returns to Chipotle, effectively tracking return visits. In this example, 40,000 people out of our original audience came back to a Chipotle in North Carolina.
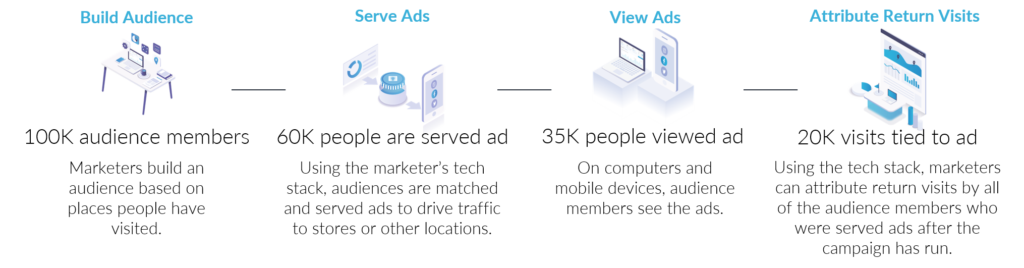
Foot Traffic Attribution Examplewith pixel tracking
Here is an example of a similar scenario, but with pixel tracking added into the equation. Pixel tracking allows marketers to tie distinct audiences and unique ads together. With pixel tracking, foot traffic attribution becomes even more water-tight.
As in the previous example, an audience of 100,000 Chipotle diners was built using location data software. Then, using the marketer’s tech stack (e.g., Google Marketing Platform, Adobe Marketing Cloud) that audience is matched and served a pixeled ad. Of those 60,000 people who were served the ad, 35,000 actually see the ad. Then, going back into the marketing platform, we can see that 20,000 people who were served the ad returned to Chipotle. With pixel tracking, marketers can see visits that are tied directly to distinct ads.
How would you describe your current ability to measure foot traffic attribution?Poll results from “Foot Traffic Attribution and the Digital Marketer” webinar on 30 Oct. 2019
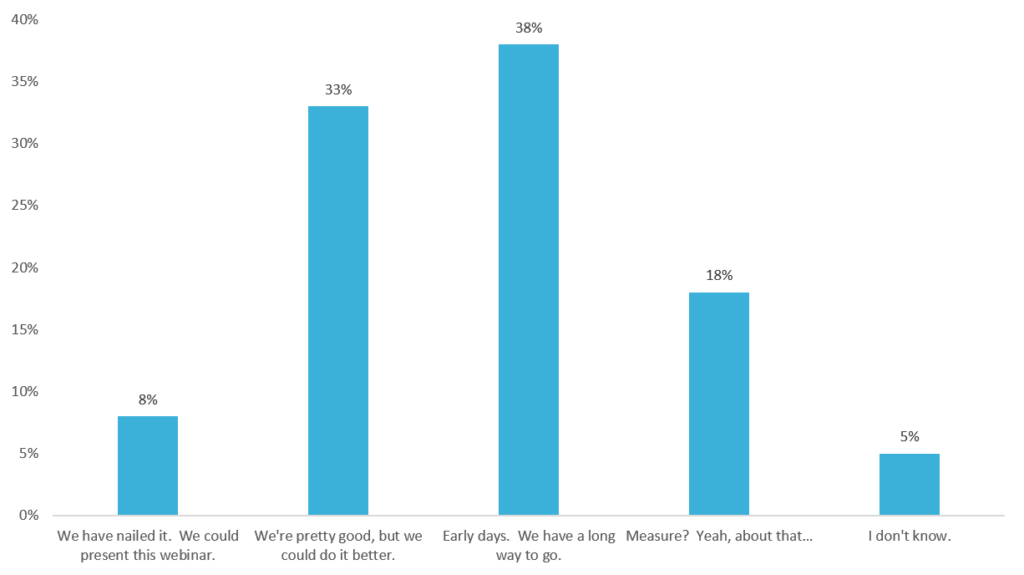
You can use these survey results to benchmark and assess your own efforts to solve for foot traffic attribution.
Steps You Can Take to Get Started
There are three core steps marketers can take to get started on measuring foot traffic attribution, regardless of your current level of technology or process sophistication.
- Define what attribution means to the organization. It could be increasing visitors to a specific location, driving visits on a certain date or within a specific window. It could mean having people visit a location and transacting while they’re there. In some cases, it could mean getting a specific audience to take a singular action, such as buy a specific SKU or spend over a certain dollar amount.
- Once your definition of success is in place, figure out what an acceptable return on investment will be. Is it just foot traffic being measured, regardless of whether anyone bought anything? Or at the other end of the continuum, are sales per square foot being measured (how much revenue a store takes in for every square foot of retail space)? This is often a determination made in collaboration with digital, product and sales teams.
- Lastly, know what solutions are available to you that can support your foot traffic attribution efforts. There are a range of scenarios where attribution plays a role and ought to be factored in. The easiest place to start is with a search using the keyword: “foot traffic attribution.”
Cast StudyAudiences and Attribution for Amusement Parks
The Set-Up and Campaign Goals
Plunge Digital, a data-driven agency, describes themselves well: “Our mission is to utilize a combination of marketing strategies to identify your target audience and eliminate marketing budget waste by implementing our granular targeting capabilities and focusing on ROI.”
Plunge Digital worked with Magic Springs Theme and Water Park in Hot Springs, AR, to increase visitors to the park during the week of the 4th of July, and specifically for their July 6th firework show.
To win Magic Springs’ business and to secure them as a long-term partner, Plunge Digital knew they needed more sophisticated approaches that delivered positive results.
The customizeability, flexibility and affordability of Visit Local’s make it a great fit for our agency. After we’ve used our own solutions to identify the most relevant audiences, we’re able to build exactly what we need and take it to the advertising platform of our choice. The foot traffic attribution reporting also provides key insights that out clients demand more and more each day.
– Nick ten Bensel, Plunge Digital’s CEO
Challenges
Magic Springs hired Plunge Digital for a proof of concept campaign. With a limited budget to execute a proof of concept campaign, Plunge Digital required a mid-market solution with attribution reporting to prove efficacy.
The key point: They needed this campaign to be a success to earn repeat business.Campaign Details
Plunge Digital used multiple solutions to execute the campaign, including their own platform and Reveal Mobile’s VISIT Local software. Through their Social Intelligence & Behaviorment Custom Insights and Analytics solution, they first identified their target market. They determined their baseline on age and income ranges, as well as their highest indexing  target geography.
From there, they looked at the top indexing brands and restaurants with which their target audience was most socially engaged. Based on their intelligence and incorporating all of the criteria above, they defined their target audience as those who visit Subway, Taco Bell and the local Oaklawn Racing Casino Resort.
Solution
Plunge Digital created a custom location-based audience of visitors to the Oaklawn Racing Casino Resort, Subways, and Taco Bells in specific local markets. With their target personas in hand, Plunge Digital created a custom location-based audience of visitors to the Oaklawn Racing Casino Resort, Subways, and Taco Bells in specific local markets.
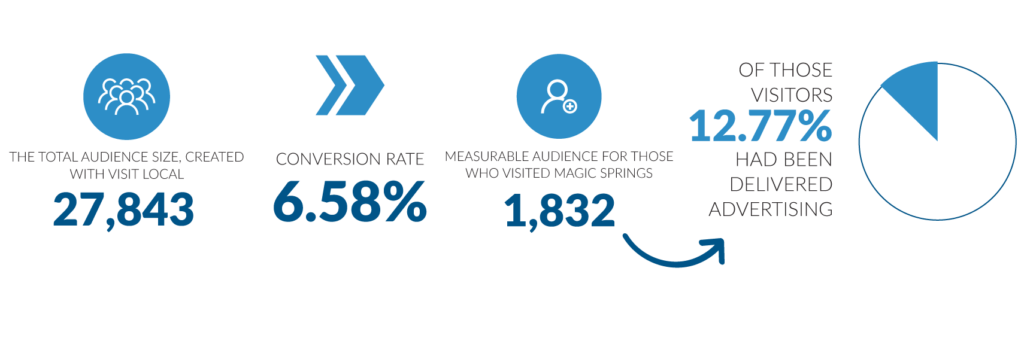
The total audience size, created with VISIT Local, was 27,843. To that audience, they served a total of 400,000 impressions, 200,000 via social media, 200,000 through digital display.
Results
While exact attendance numbers for June 22nd – July 6th were not available, the measurable audience for those who visited Magic Springs was 1,832 during the campaign period. Of those visitors, 234, or 12.77%, had been delivered advertising. Overall, there was a 6.58% conversion rate out of the audience of 27,843.
On July 6th there were 575 measured visitors. From that base, a total of 42, or 7.3%, were in the audience reached during the campaign. Because of this success, Plunge Digital has demonstrated an effective and measurable marketing solution, leading to more repeat business.
Updated 1/8/2021