


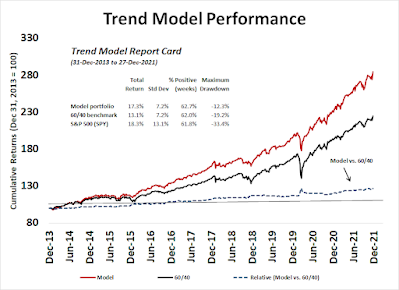
The Trend Asset Allocation Model is an asset allocation model that applies trend following principles based on the inputs of global stock and commodity price. This model has a shorter time horizon and tends to turn over about 4-6 times a year. The performance and full details of a model portfolio based on the out-of-sample signals of the Trend Model can bsoe found here.
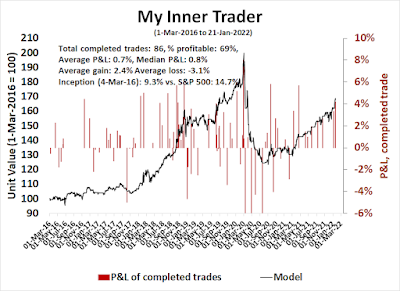
My inner trader uses a trading model, which is a blend of price momentum (is the Trend Model becoming more bullish, or bearish?) and overbought/oversold extremes (don't buy if the trend is overbought, and vice versa). Subscribers receive real-time alerts of model changes, and a hypothetical trading record of the email alerts is updated weekly here. The hypothetical trading record of the trading model of the real-time alerts that began in March 2016 is shown below.
The latest signals of each model are as follows:
- Ultimate market timing model: Buy equities*
- Trend Model signal: Bullish*
- Trading model: Bearish*
Update schedule: I generally update model readings on my site on weekends and tweet mid-week observations at @humblestudent. Subscribers receive real-time alerts of trading model changes, and a hypothetical trading record of those email alerts is shown here.
Subscribers can access the latest signal in real-time here.
Estimating downside riskLast week, I highlighted a sell signal from the intermediate-term breadth momentum oscillator (ITBM). The 14-day RSI of ITBM had recycled from an overbought condition, which was a sell signal for the stock market. In the past, ITBM sell signals have resolved with 5-10% drawdowns and the market bottomed with the ITBM RSI fell to an oversold or near oversold condition.
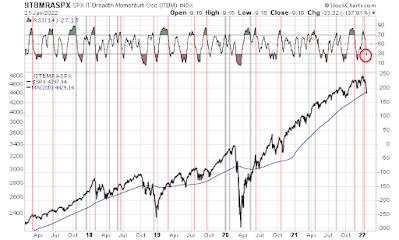
The S&P 500 fell -5.8% since the sell signal and RSI is oversold. Does this indicate a short-term bottom, or is this the start of a major bear leg?
The full post can be found here.
