


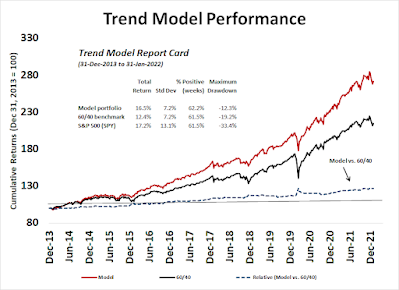
The Trend Asset Allocation Model is an asset allocation model that applies trend following principles based on the inputs of global stock and commodity price. This model has a shorter time horizon and tends to turn over about 4-6 times a year. The performance and full details of a model portfolio based on the out-of-sample signals of the Trend Model can bsoe found here.
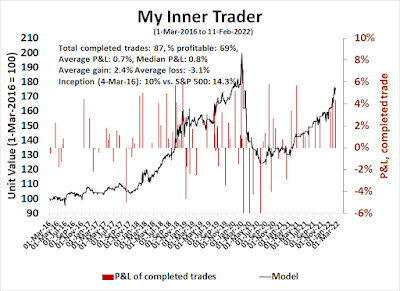
My inner trader uses a trading model, which is a blend of price momentum (is the Trend Model becoming more bullish, or bearish?) and overbought/oversold extremes (don't buy if the trend is overbought, and vice versa). Subscribers receive real-time alerts of model changes, and a hypothetical trading record of the email alerts is updated weekly here. The hypothetical trading record of the trading model of the real-time alerts that began in March 2016 is shown below.
The latest signals of each model are as follows:
- Ultimate market timing model: Buy equities*
- Trend Model signal: Neutral*
- Trading model: Bullish*
Update schedule: I generally update model readings on my site on weekends and tweet mid-week observations at @humblestudent. Subscribers receive real-time alerts of trading model changes, and a hypothetical trading record of those email alerts is shown here.
Subscribers can access the latest signal in real-time here.
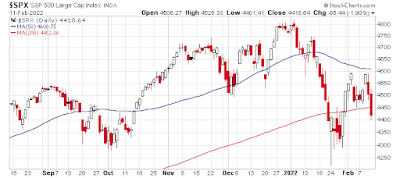
Another 200 dma testIn the wake of the drama that played out in the stock market last week, the S&P 500 weakened to test the 200 dma. Is this just a re-test of the January lows or the start of a new bear leg?
To answer that question, I step outside the realm of pure technical analysis and pose three questions for both bulls and bears.
- What will happen to earnings and earnings expectations in the wake of the hot January CPI report that spooked the market?
- Fed Funds futures are now discounting a half-point liftoff at the March FOMC meeting. Some analysts have even speculated that the Fed may raise by a quarter-point in a surprise inter-meeting move. Will the Fed acquiesce or push back against those expectations?
- If stock prices were to weaken further, how will insiders react?
