


Peloton Interactive, Inc. (PTON) is a prominent pandemic-era meme stock that garnered significant attention from retail investors on social media platforms. The COVID-19-driven fitness frenzy has propelled PTON to experience exponential growth. Moreover, the closure of traditional brick-and-mortar gyms substantially boosted its business.
However, the post-pandemic decline in product sales and subscriptions has been a bummer for the exercise equipment manufacturer. In addition, safety issues have further plagued the company, with a 2021 recall of its treadmills following reports of multiple injuries and a child’s death in a tragic accident, tarnishing the brand’s reputation.
Additionally, the company expects a seasonal decline in subscriber growth in the current quarter and a drop in revenue. CEO Barry McCarthy said in a letter to shareholders that this quarter “will be among our most challenging from a growth perspective.”
Nevertheless, PTON has recently unveiled a rebranding strategy, introducing additional app membership tiers, including a free version. This move aims to widen the company’s reach by offering new options for consumers, allowing them to experience the fitness-focused organization’s offerings first-hand.
While PTON’s emphasis on its subscription business may help facilitate a turnaround, it faces formidable competition from renowned apps, including Apple’s Fitness+. Consequently, investing in PTON remains risky.
To better comprehend Peloton's challenges and why it may be prudent to steer clear of its stock, let us examine some of the company’s key metrics.
Analyzing PTON’s Financial Performance: Net Income, Revenue, Gross Margin & Current Ratio Trends
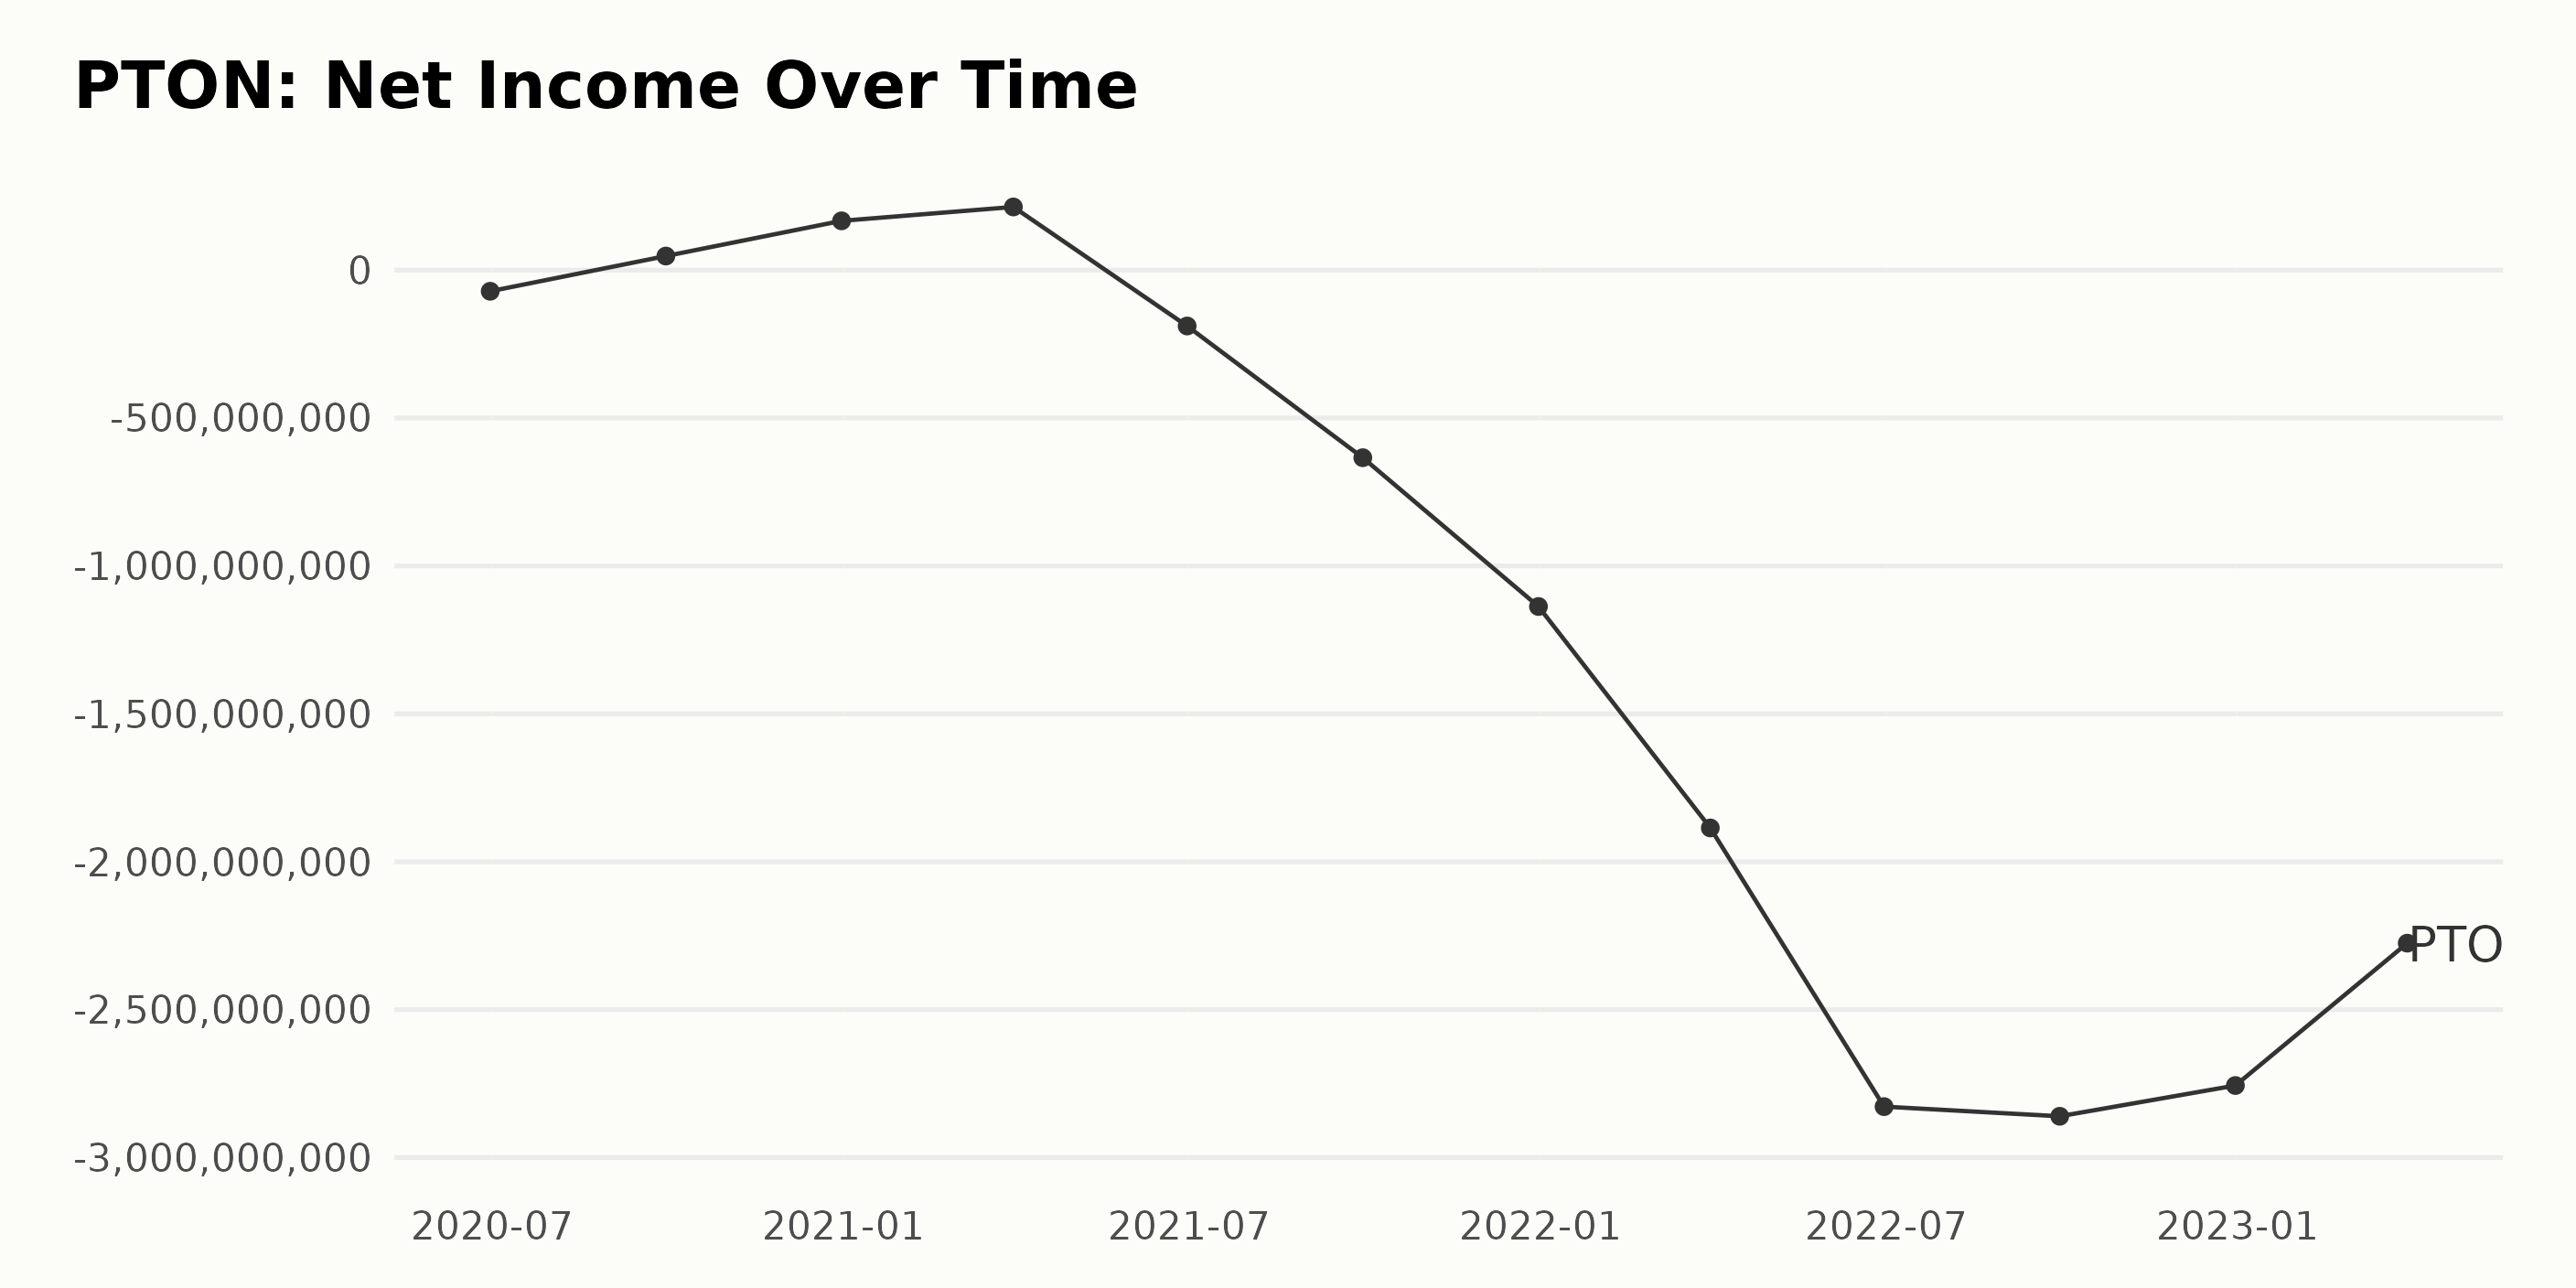
The trend and fluctuations of PTON’s trailing-12-month net income can be summarized as follows: -
In June 2020, PTON’s net income was -$71.6 million. The net income showed improvement and became positive, reaching $47.4 million in September 2020 and further increasing to $166.4 million by December 2020.
A significant increase was seen in March 2021, with the net income reaching $213.4 million. However, the net income returned to negative in June 2021, reaching -$189 million, and continued to decline over time.
The largest recorded net loss for PTON was in September 2022, with a value of -$2.86 billion, before showing slight improvement in subsequent quarters. More recently, as of March 2023, the net income stands at -$2.28 billion.
PTON’s net income shows a negative growth rate when measuring from the first value in June 2020 to the last value in March 2023. The more recent data indicates a continuous decline in net income with only slight improvements towards the end of the series.
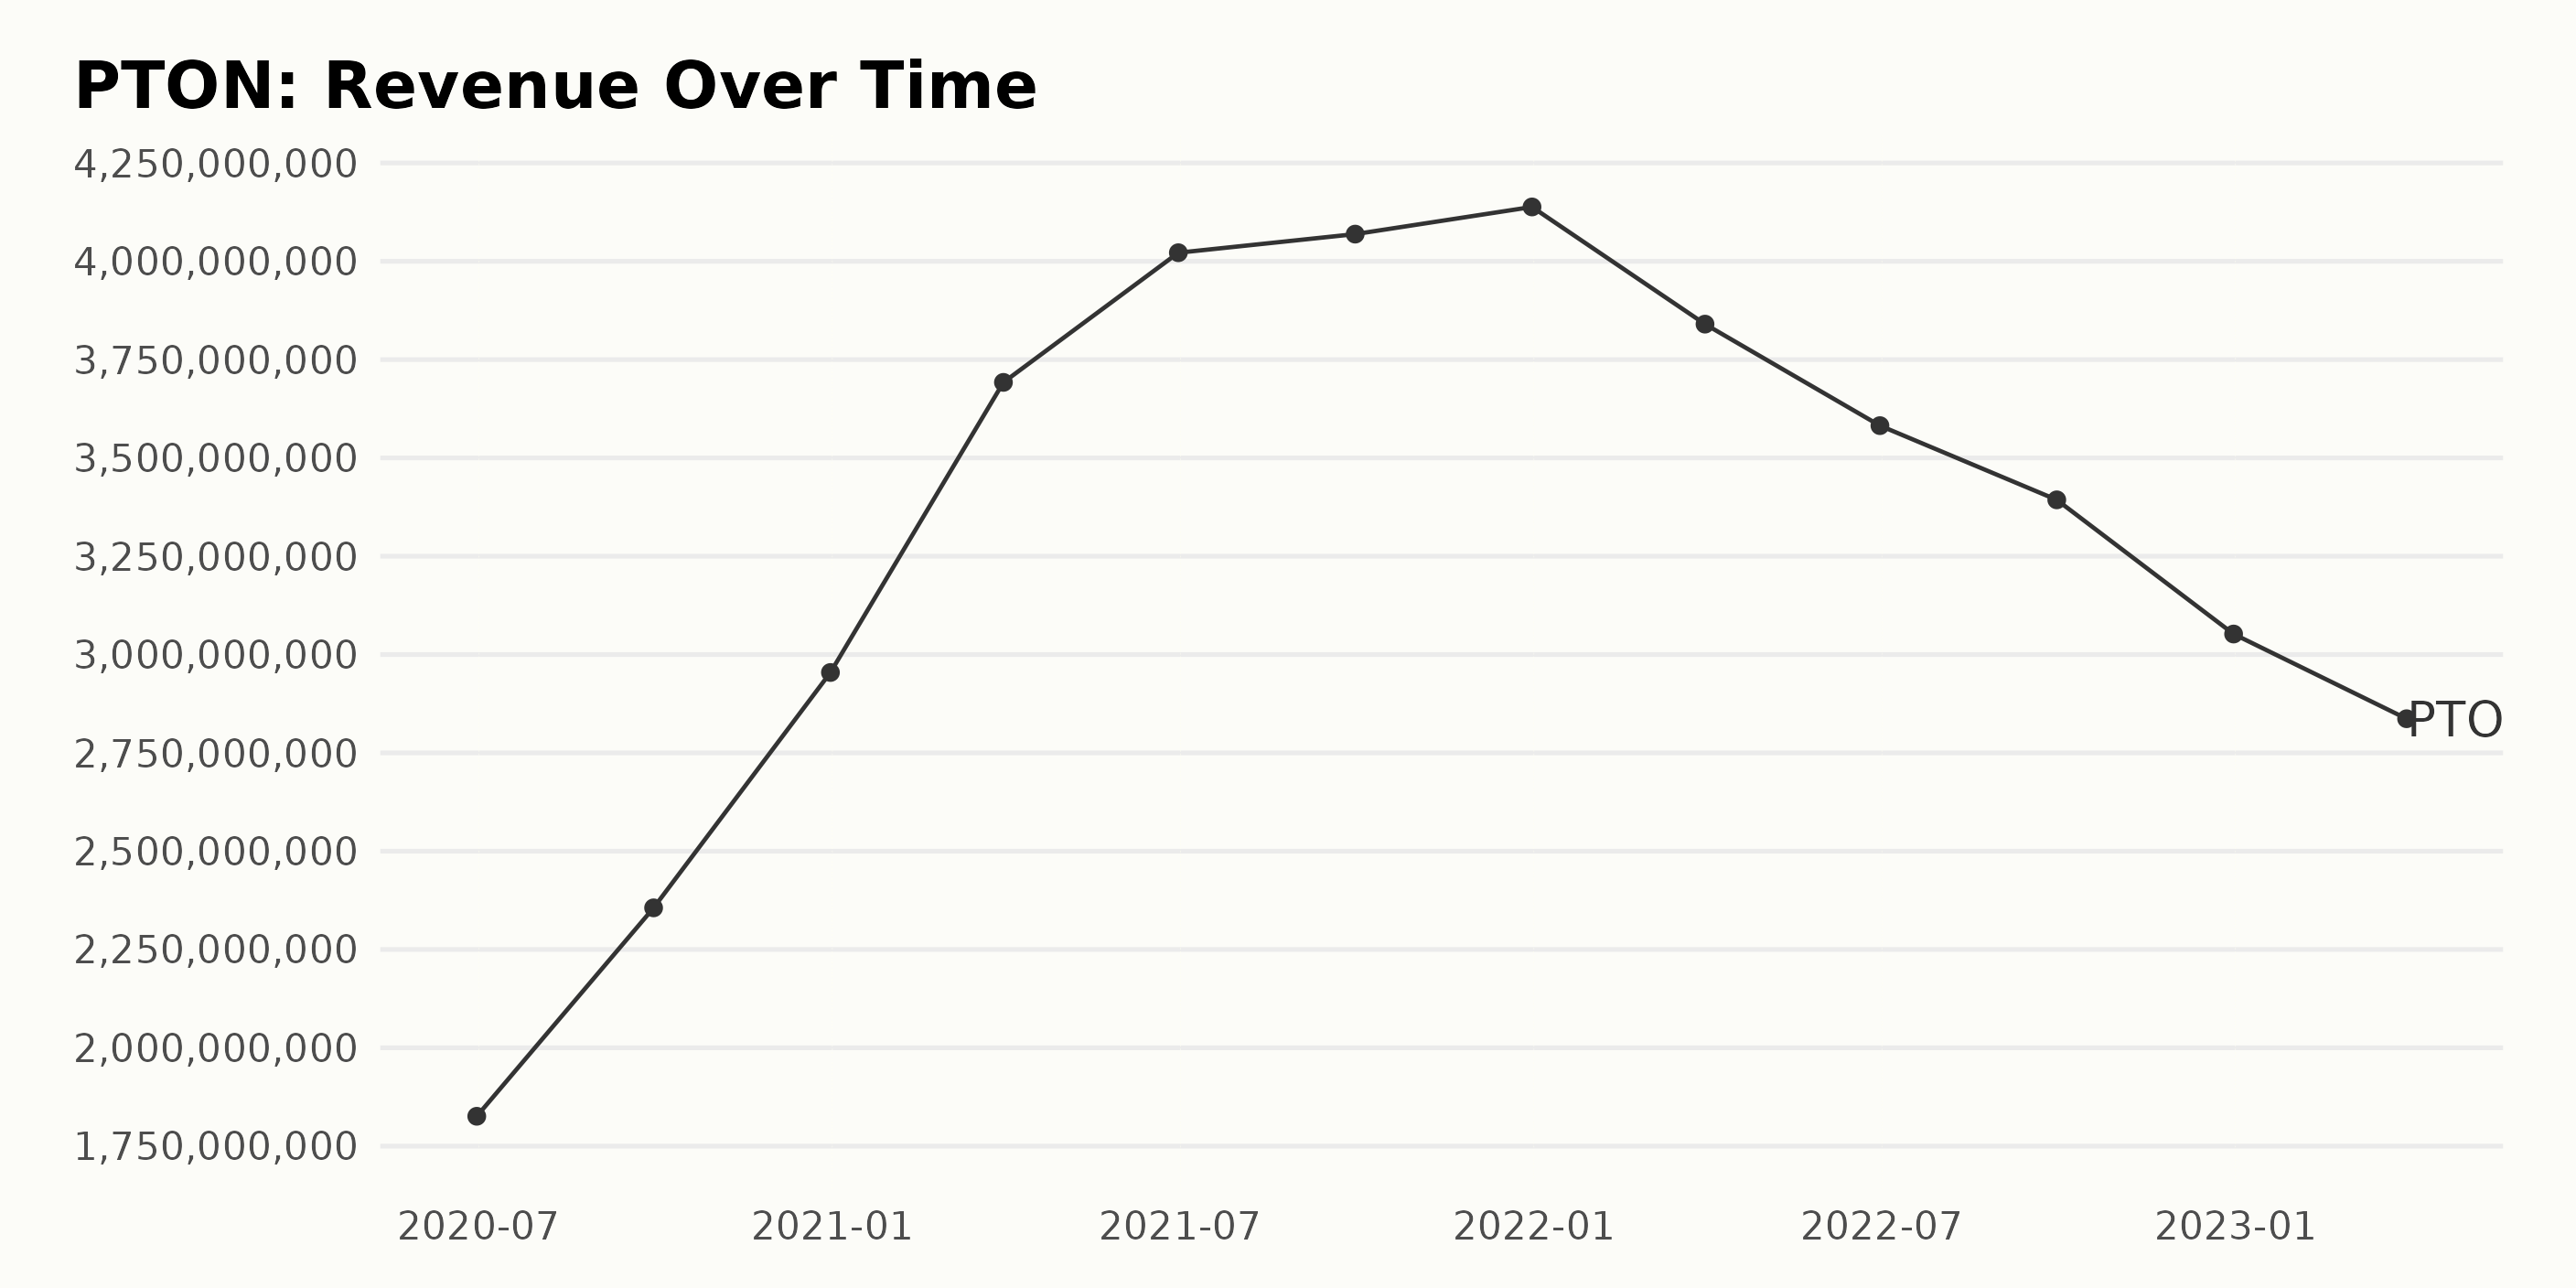
Below is the summary of trailing-12-month revenue data for PTON, focusing more on recent trends:
- June 2020: $1.83 billion
- September 2020: $2.36 billion
- December 2020: $2.95 billion
- March 2021: $3.69 billion
- June 2021: $4.02 billion
- September 2021: $4.07 billion
- December 2021: $4.14 billion
- March 2022: $3.84 billion
- June 2022: $3.58 billion
- September 2022: $3.39 billion
- December 2022: $3.05 billion
- March 2023: $2.84 billion
From June 2020 to December 2021, PTON showed increasing revenue, with a peak around the end of 2021 ($4.14 billion). In early 2022, however, revenue declined and dropped to $2.84 billion by March 2023. The growth rate between the first and last values is approximately 55%. Recent trends show a decrease in PTON’s revenue, contrasting with its predominantly positive performance in the previous period.
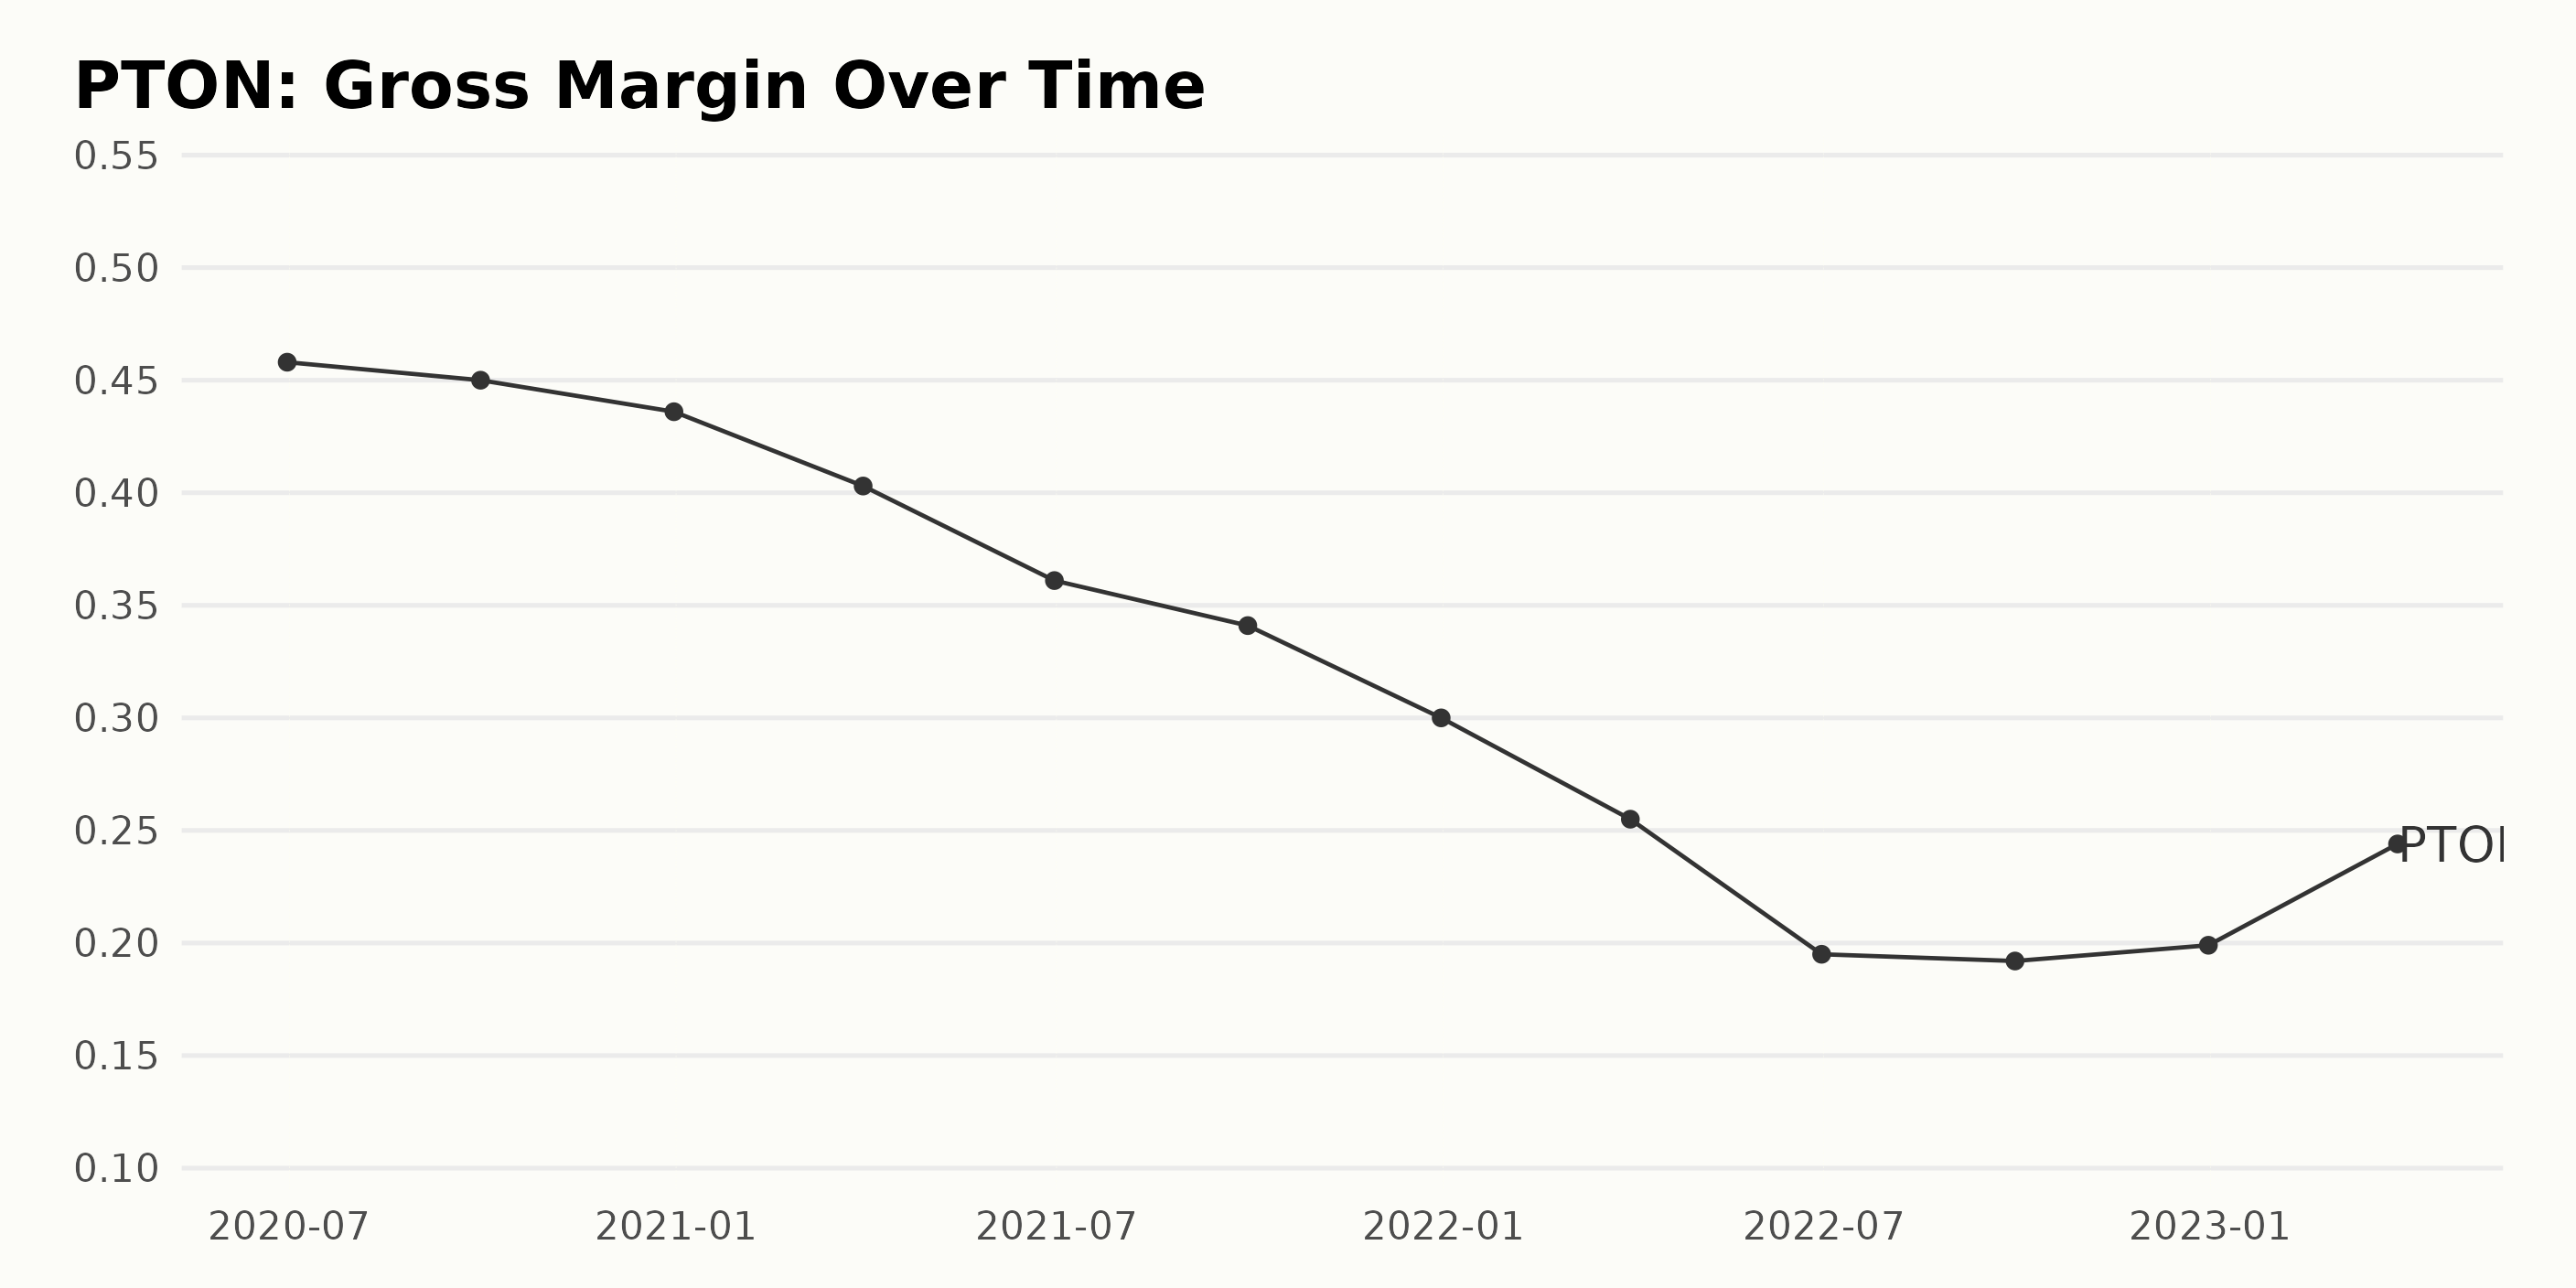
PTON’s gross margin has experienced an overall downtrend from June 2020 to March 2023, with fluctuations occurring throughout the period. Below are the key data points:
- June 2020: 45.8%
- September 2020: 45.0%
- December 2020: 43.6%
- March 2021: 40.3%
- June 2021: 36.1%
- September 2021: 34.1%
- December 2021: 30.0%
- March 2022: 25.5%
- June 2022: 19.5%
- September 2022: 19.2%
- December 2022: 19.9%
- March 2023: 24.4%
Over this period, PTON’s gross margin declined substantially from 45.8% in June 2020 to a low of 19.2% in September 2022. Starting in December 2022, there has been a slight recovery, reaching 24.4% in March 2023. The growth rate (measuring the last value from the first value) is -46.29%.
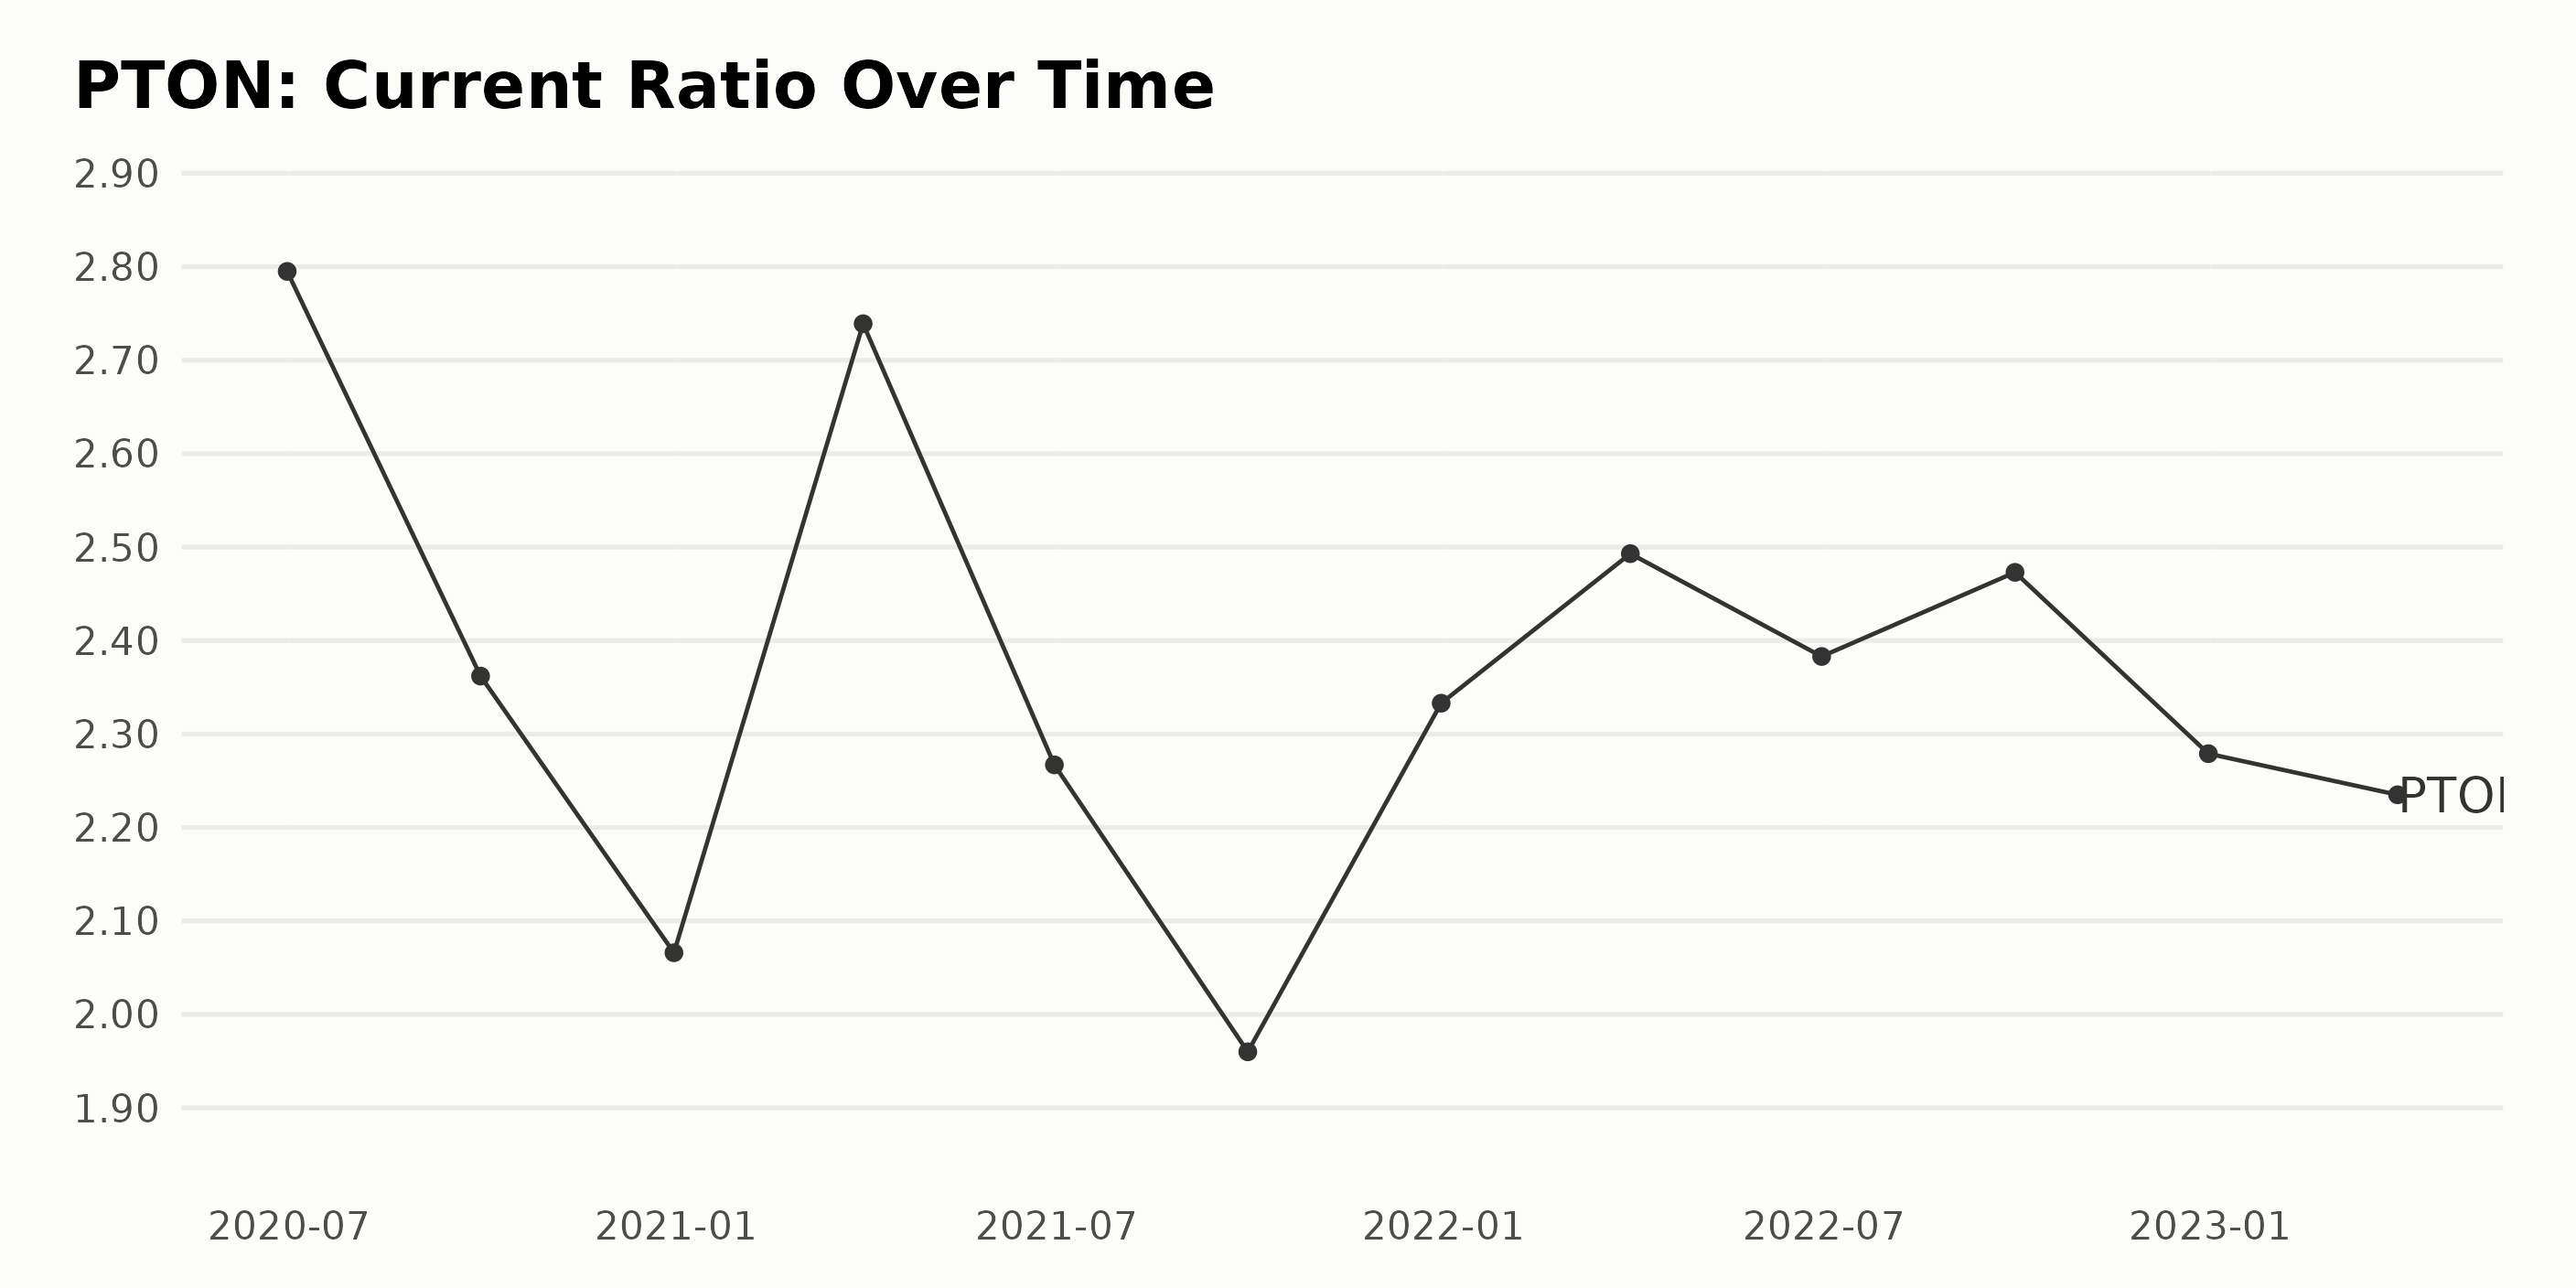
The current ratio of the publicly traded U.S. company PTON has experienced both trends and fluctuations over the given series of data. Here is a summary:
From June 2020 to March 2023, the overall growth rate of PTON’s current ratio is -20.04%. The highest current ratio value was observed on June 30, 2020, at 2.80. The lowest current ratio value was recorded on September 30, 2021, at 1.96. Recent trends and fluctuations:
- In the time period between December 31, 2021 (2.33) and March 31, 2023 (2.24), the current ratio experienced a slight decrease (-4.24%).
- Before that, between September 30, 2022 (2.47) and December 31, 2022 (2.28), it saw a decline in value (-7.90%).
- However, the ratio increased between June 30, 2022 (2.38), and September 30, 2022 (2.47), showing a growth of 3.78% during that period.
In conclusion, while PTON’s current ratio has experienced fluctuations over the past few years, the most recent values highlight a general downward trend.
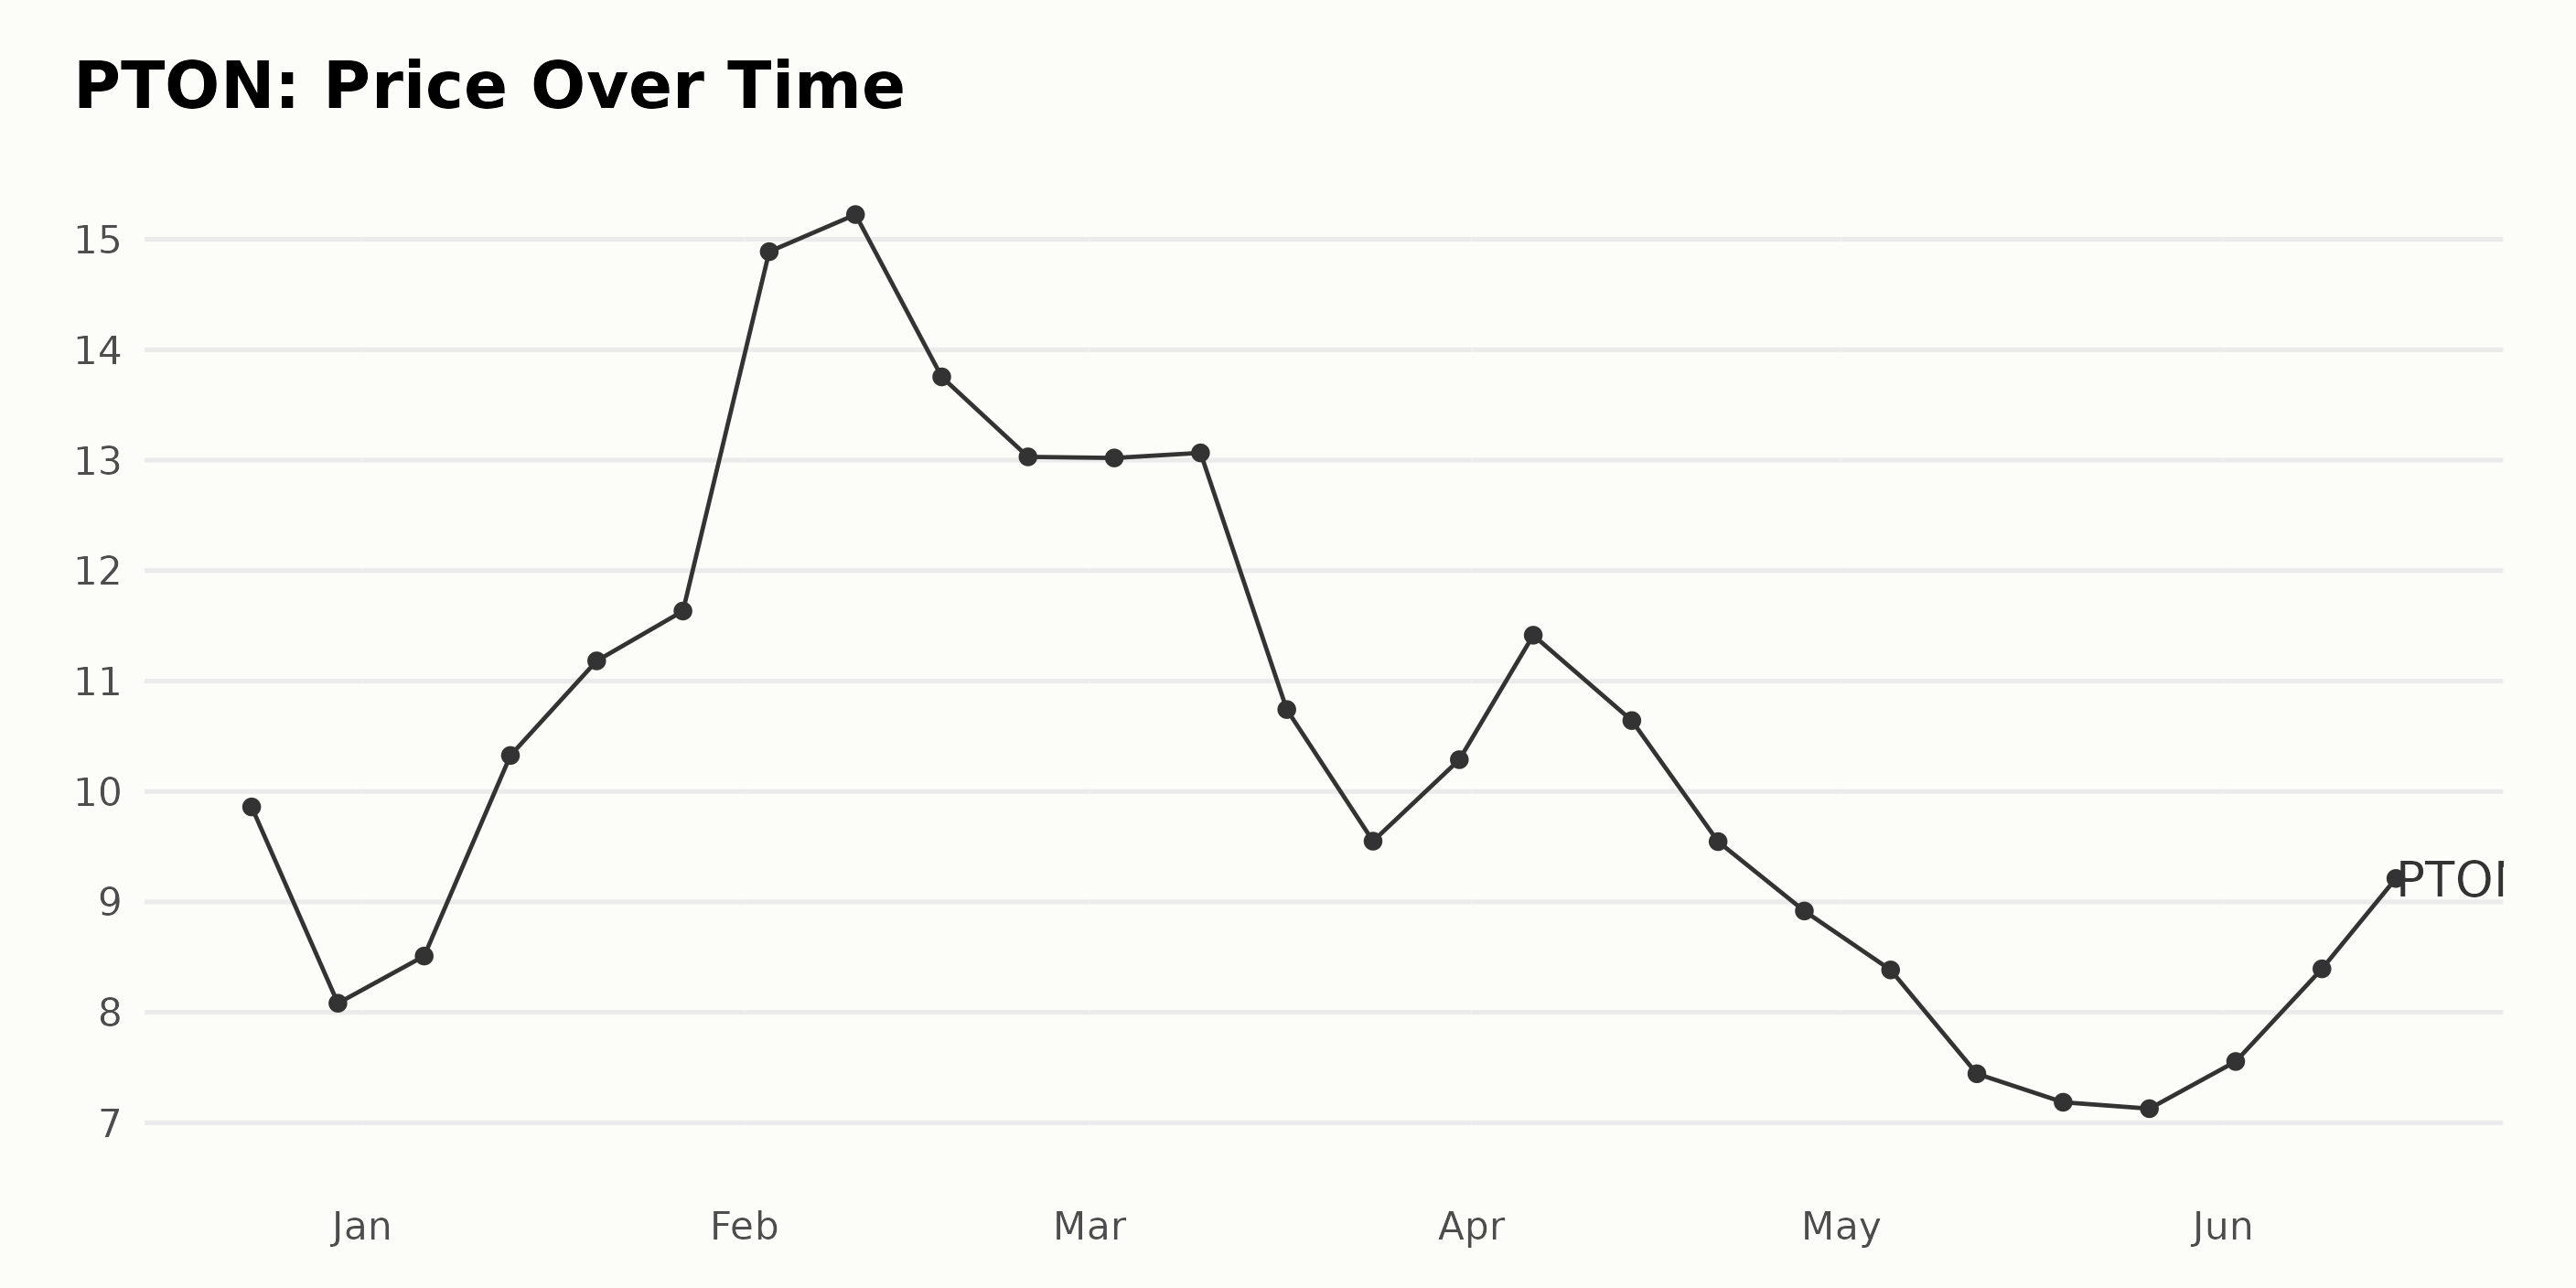
PTON Share Price: Rollercoaster Ride of Growth, Decline, and Slow Recovery
The prices initially fell in late December 2022 and then increased in January 2023, reaching a peak of $15.22 on February 10. PTON’s share prices then declined afterward until May 2023, reaching a low of $7.12 on May 26. From June 2023, the prices start to recover slowly, with PTON’s share price reaching $8.96 by June 15, 2023.
In summary, PTON’s share prices experienced an initial increase, followed by a decline and a subsequent slow recovery toward the end of the data set. No clear accelerating or decelerating trends are evident. Here is a chart of PTON’s price over the past 180 days.
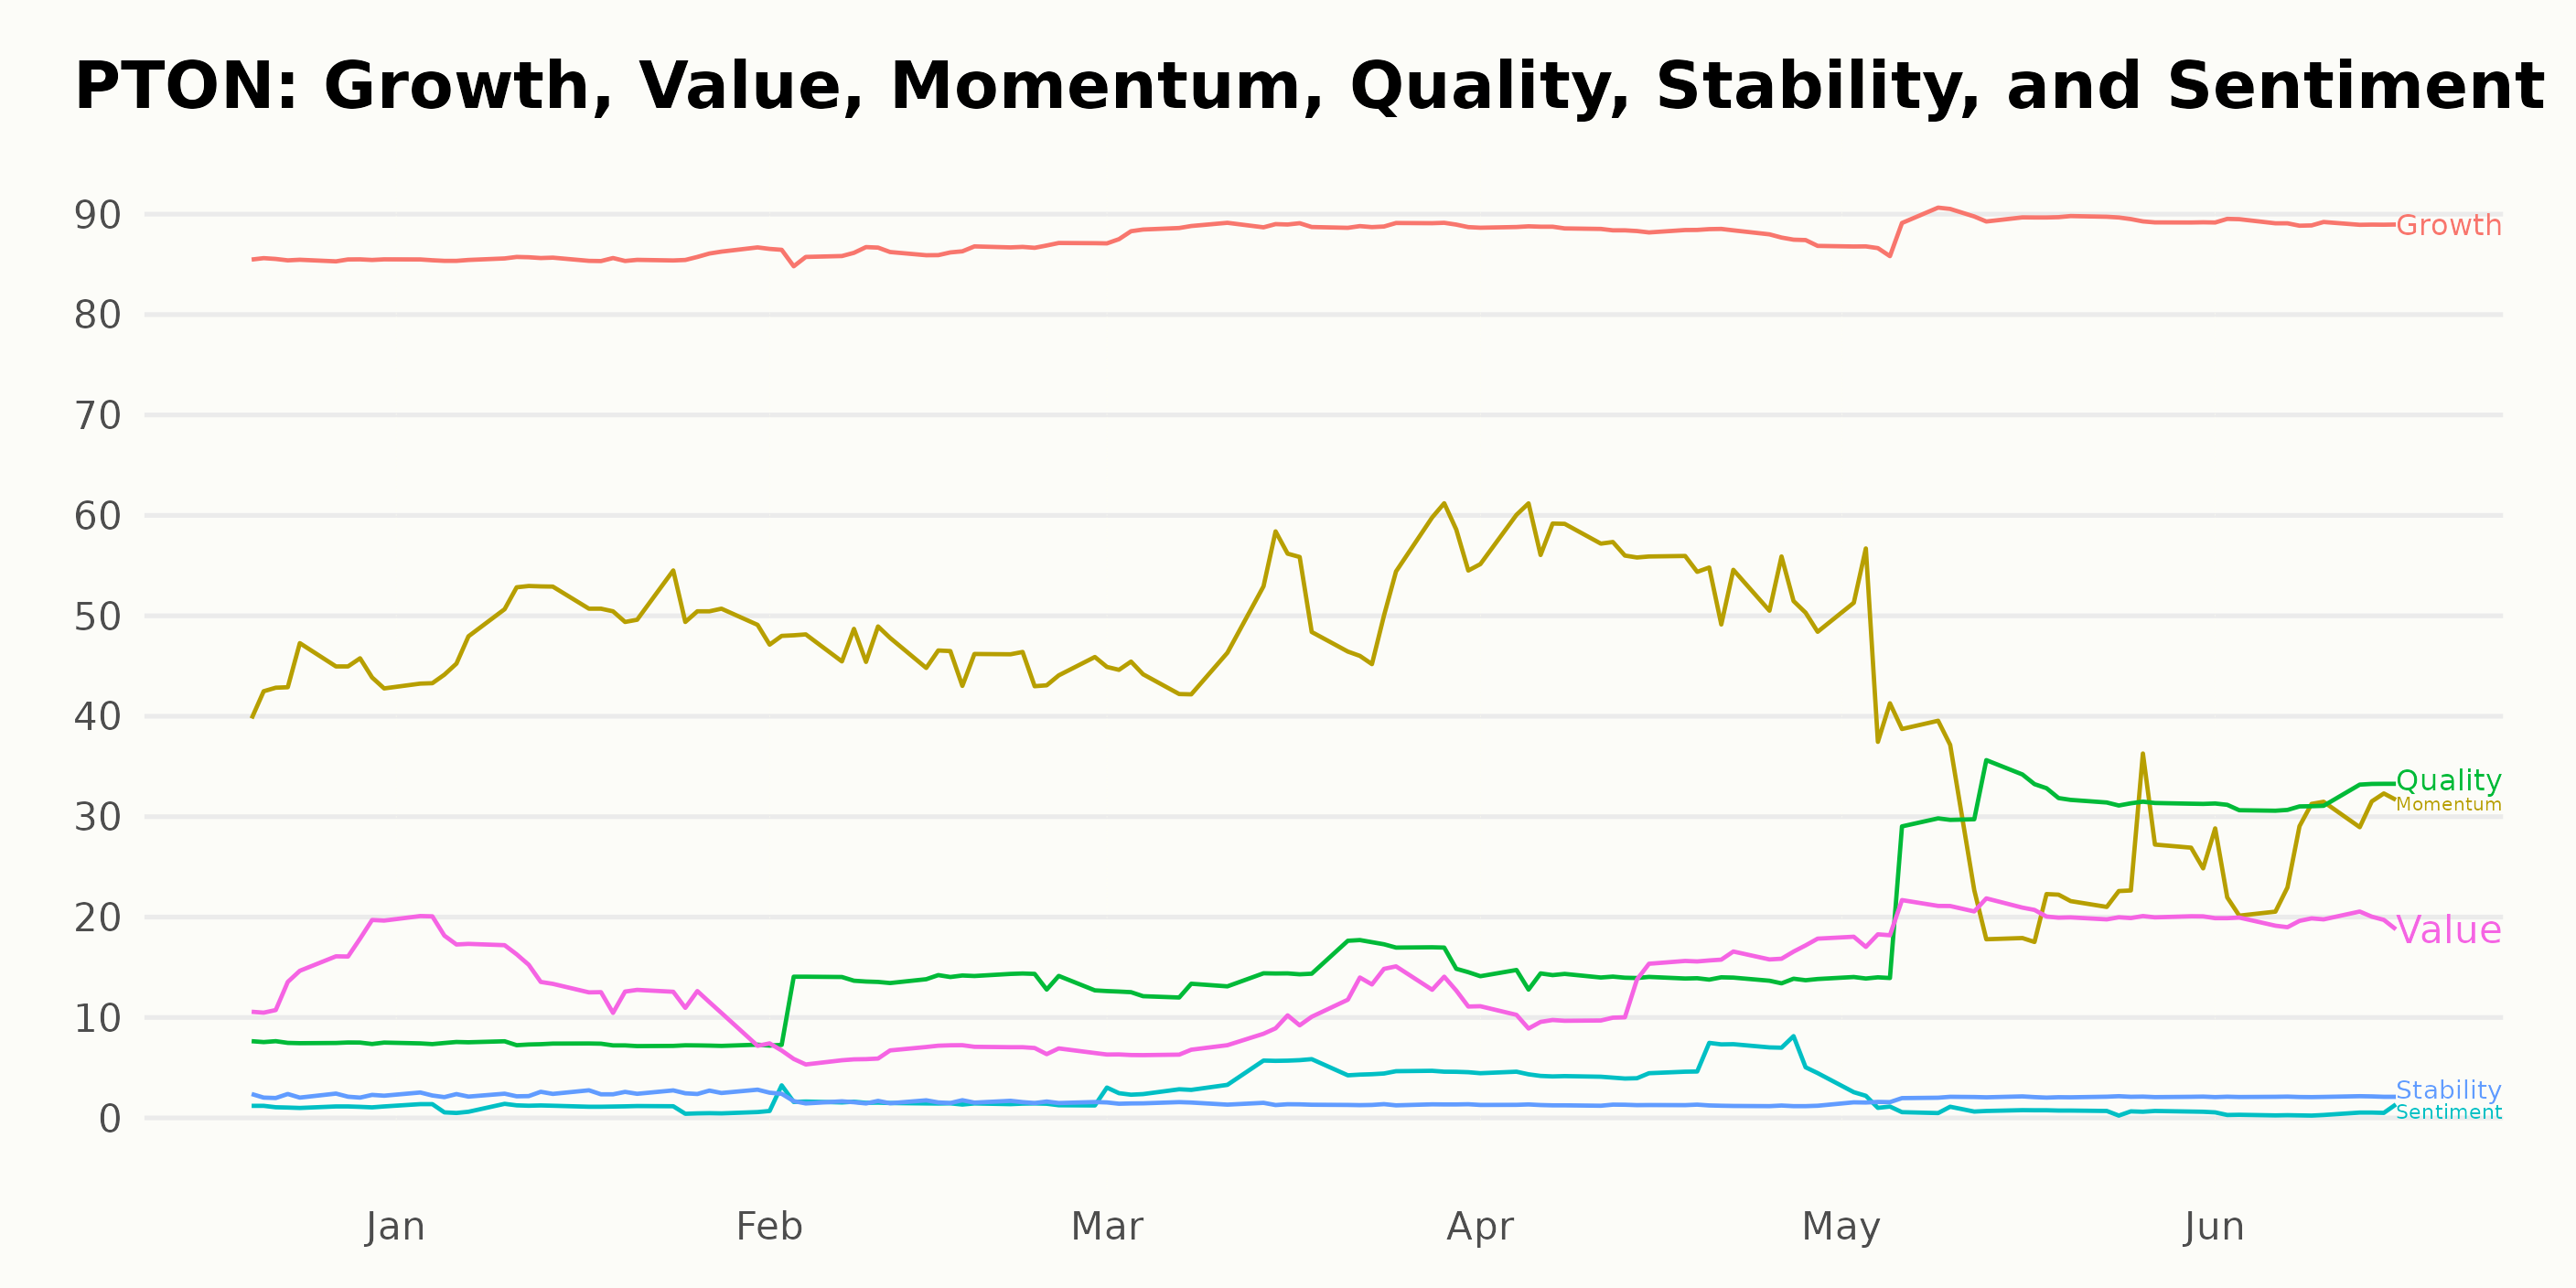
Analyzing PTON’s POWR Ratings
PTON has an overall D rating, translating to a Sell in our POWR Ratings system. It is ranked #47 out of the 52 stocks in the Consumer Goods category, suggesting a relatively inferior performance compared to its peers. It has an F grade in Stability and Sentiment and a D in Value.
Below is the summary of PTON’s POWR Ratings and rank in the Consumer Goods category over time:
- December 24, 2022: POWR Ratings - F, Rank in Category - 57
- January 7, 2023: POWR Ratings - F, Rank in Category - 58
- January 21, 2023: POWR Ratings - F, Rank in Category - 55
- February 25, 2023: POWR Ratings - F, Rank in Category - 55
- March 18, 2023: POWR Ratings - F, Rank in Category - 51
- April 1, 2023: POWR Ratings - D, Rank in Category - 50
- April 22, 2023: POWR Ratings - F, Rank in Category - 50
- May 6, 2023: POWR Ratings - D, Rank in Category - 48
- May 27, 2023: POWR Ratings - D, Rank in Category - 48
- June 15, 2023: POWR Ratings - D, Rank in Category – 47
Stocks to Consider Instead of Peloton Interactive, Inc. (PTON)
Other stocks in the Consumer Goods sector that may be worth considering are KOSÉ Corporation (KSRYY), Ennis Inc. (EBF), and Kimberly-Clark de México, S. A. B. de C. V. (KCDMY) -- they have better POWR Ratings.
Is the Bear Market Over?
Investment pro Steve Reitmeister sees signs of the bear market’s return. That is why he has constructed a unique portfolio to not just survive that downturn...but even thrive!
Steve Reitmeister’s Trading Plan & Top Picks >
PTON shares were trading at $8.75 per share on Friday afternoon, down $0.21 (-2.34%). Year-to-date, PTON has gained 10.20%, versus a 15.76% rise in the benchmark S&P 500 index during the same period.
About the Author: Subhasree Kar

Subhasree’s keen interest in financial instruments led her to pursue a career as an investment analyst. After earning a Master’s degree in Economics, she gained knowledge of equity research and portfolio management at Finlatics.
The post Is Peloton Interactive (PTON) a Buy, Sell or Hold this Month? appeared first on StockNews.com