


Rivian Automotive, Inc. (RIVN) is a producer and retailer of Electric Vehicles (EVs) and related accessories. Their product lineup includes five-passenger pickup trucks and seven-passenger sports utility vehicles.
The company raised its full-year production forecast recently to 52,000 total units. RIVN also delivered 12,640 vehicles in the April-June period, beating analysts' estimates of 11,000.
However, the company is burning through its cash to ramp up production. Although RIVN’s CEO RJ Scaringe stated that it has enough cash to last through 2025, for the six months ended June 30, its cash, cash equivalents, and restricted cash at the end of the period came in at $9.26 billion, down 40.1% year-over-year.
Given this backdrop, let’s look at the trends of RIVN’s key financial metrics to understand why it could be wise to avoid the stock now.
Analyzing RIVN's Financial Performance: Trends in Net Income and Key Ratios
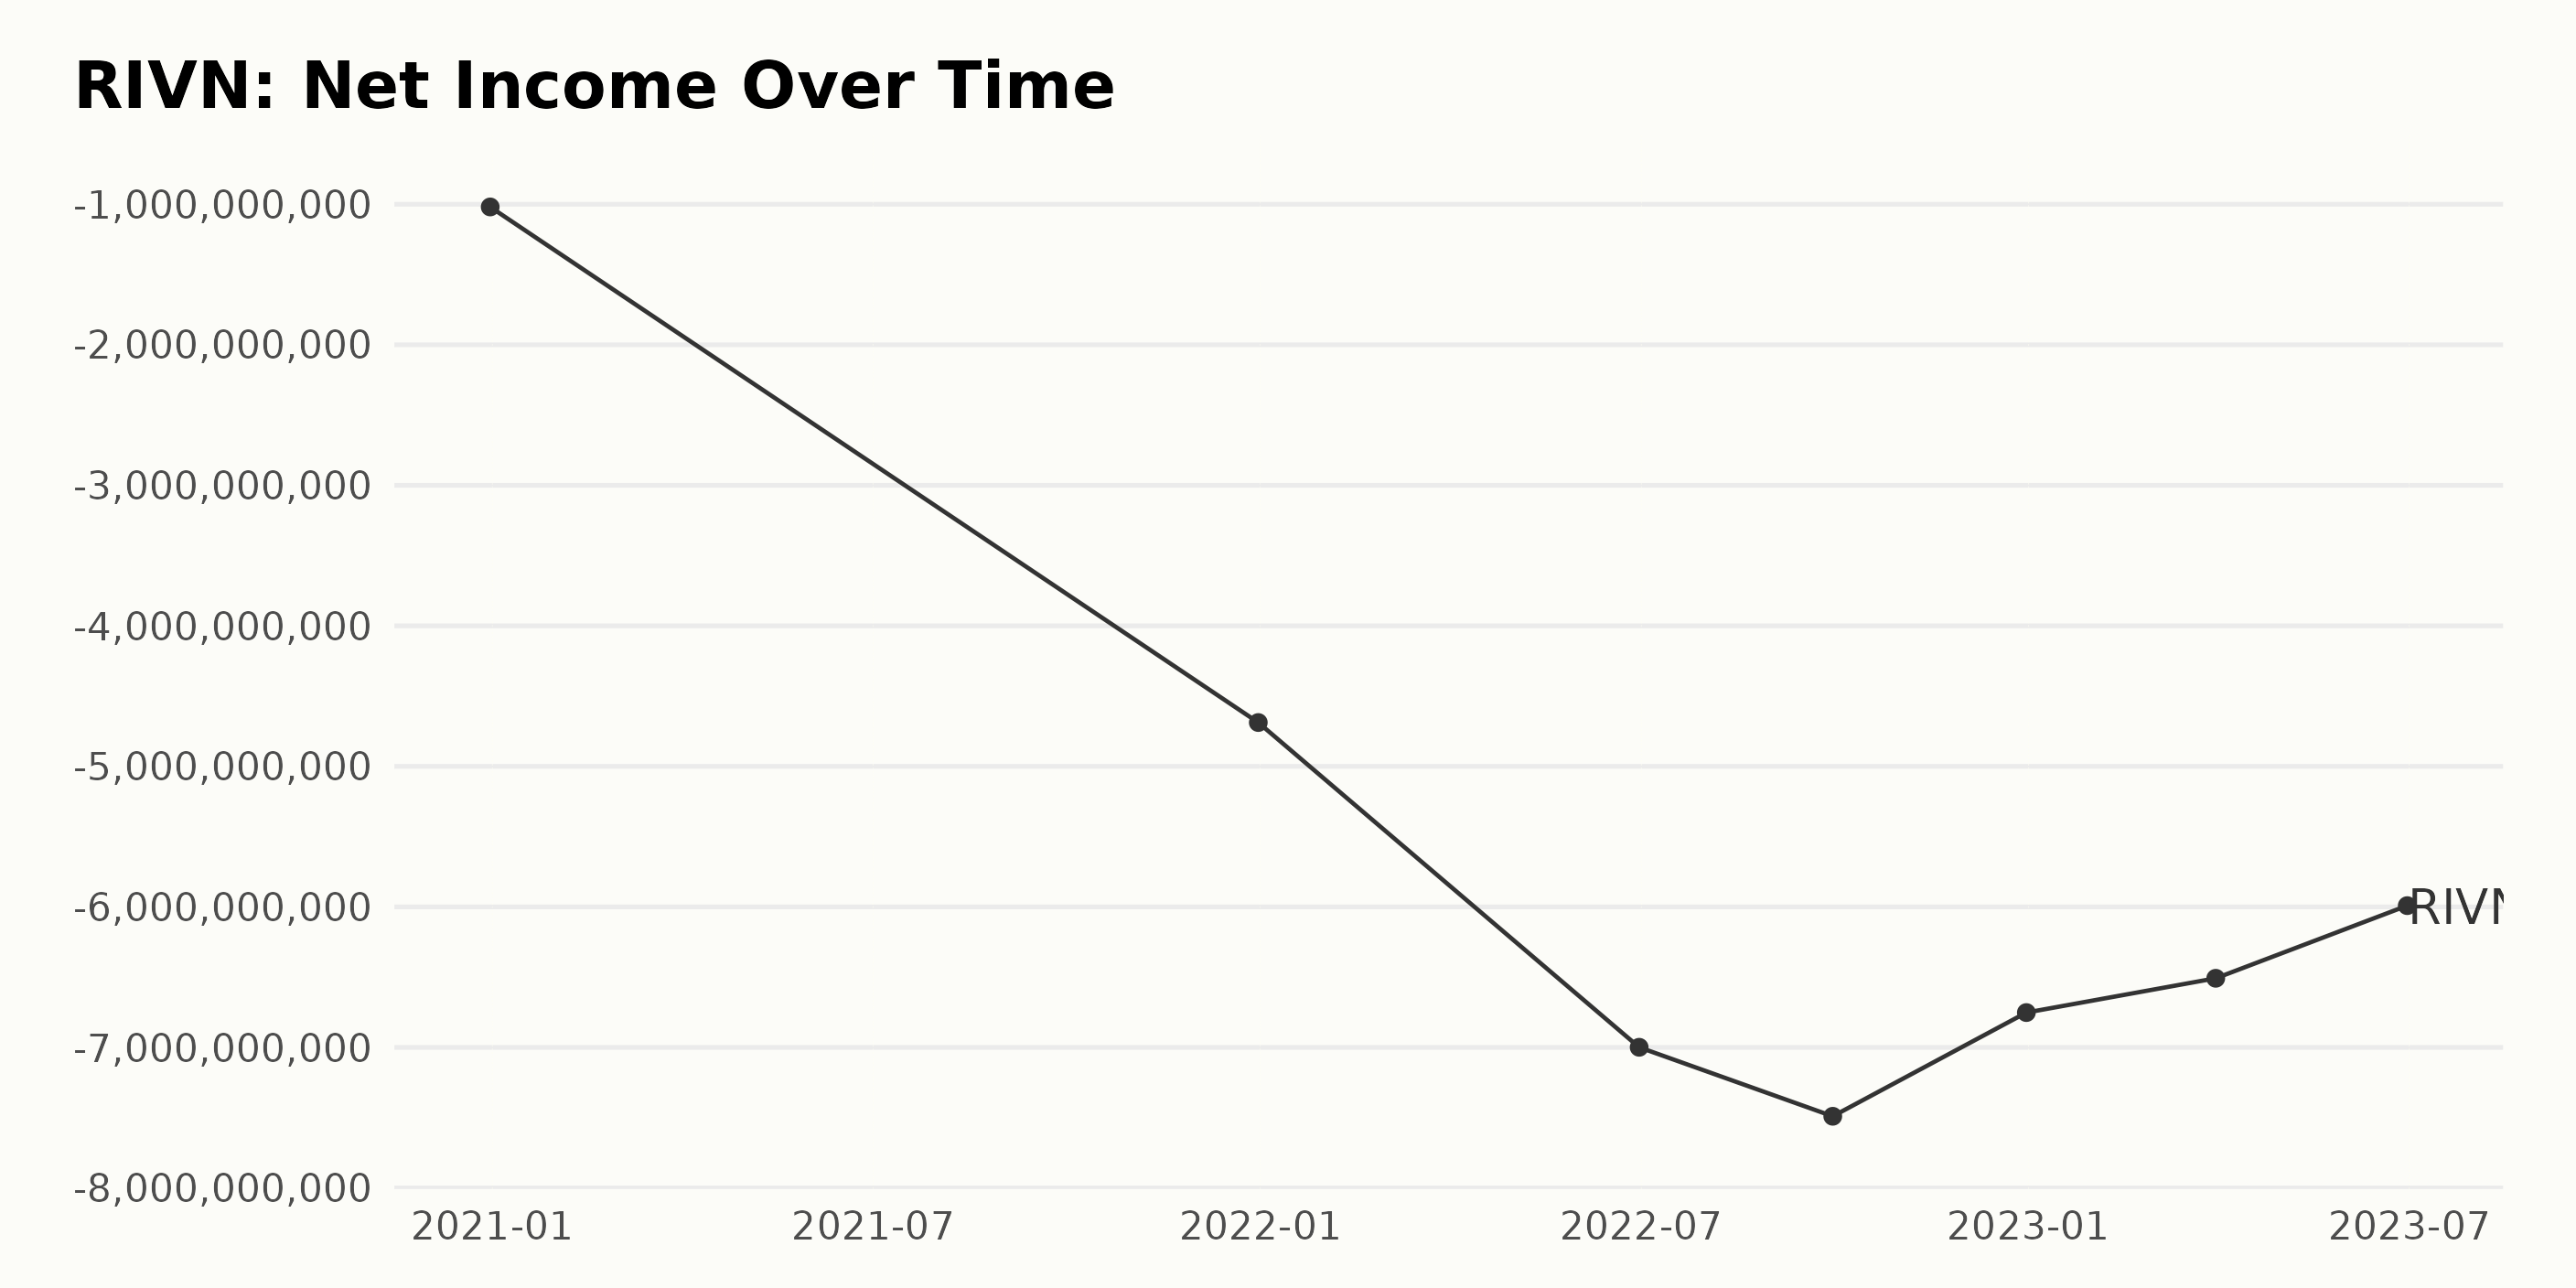
The analysis of RIVN's trailing-12-month net income over the reported period showcases a fluctuating yet overall increasing trend in losses:
- By December 31, 2020, RIVN reported a net income of approximately -$1.02 billion.
- The net income plunged significantly to approximately -$4.69 billion by December 31, 2021.
- By June 30, 2022, the net income had further decreased to about -$7 billion.
- It reached approximately -$7.49 billion by September 30, 2022.
- Coming to the end of 2022 on December 31, there was a significant reduction in net losses to approximately -$6.75 billion.
- Heading into 2023, the net losses show a declining trend, with -$6.51 billion on March 31 and -$5.99 billion on June 30, respectively.
Considering the first and last values, we witness an increase in losses from -$1.02 billion in December 2020 to -$5.99 billion in June 2023, indicating a negative growth rate. However, it's pertinent to note that more recent data, from 2022 onwards, shows a declining trend in losses, suggesting possible improvements in RIVN's net income scenario.
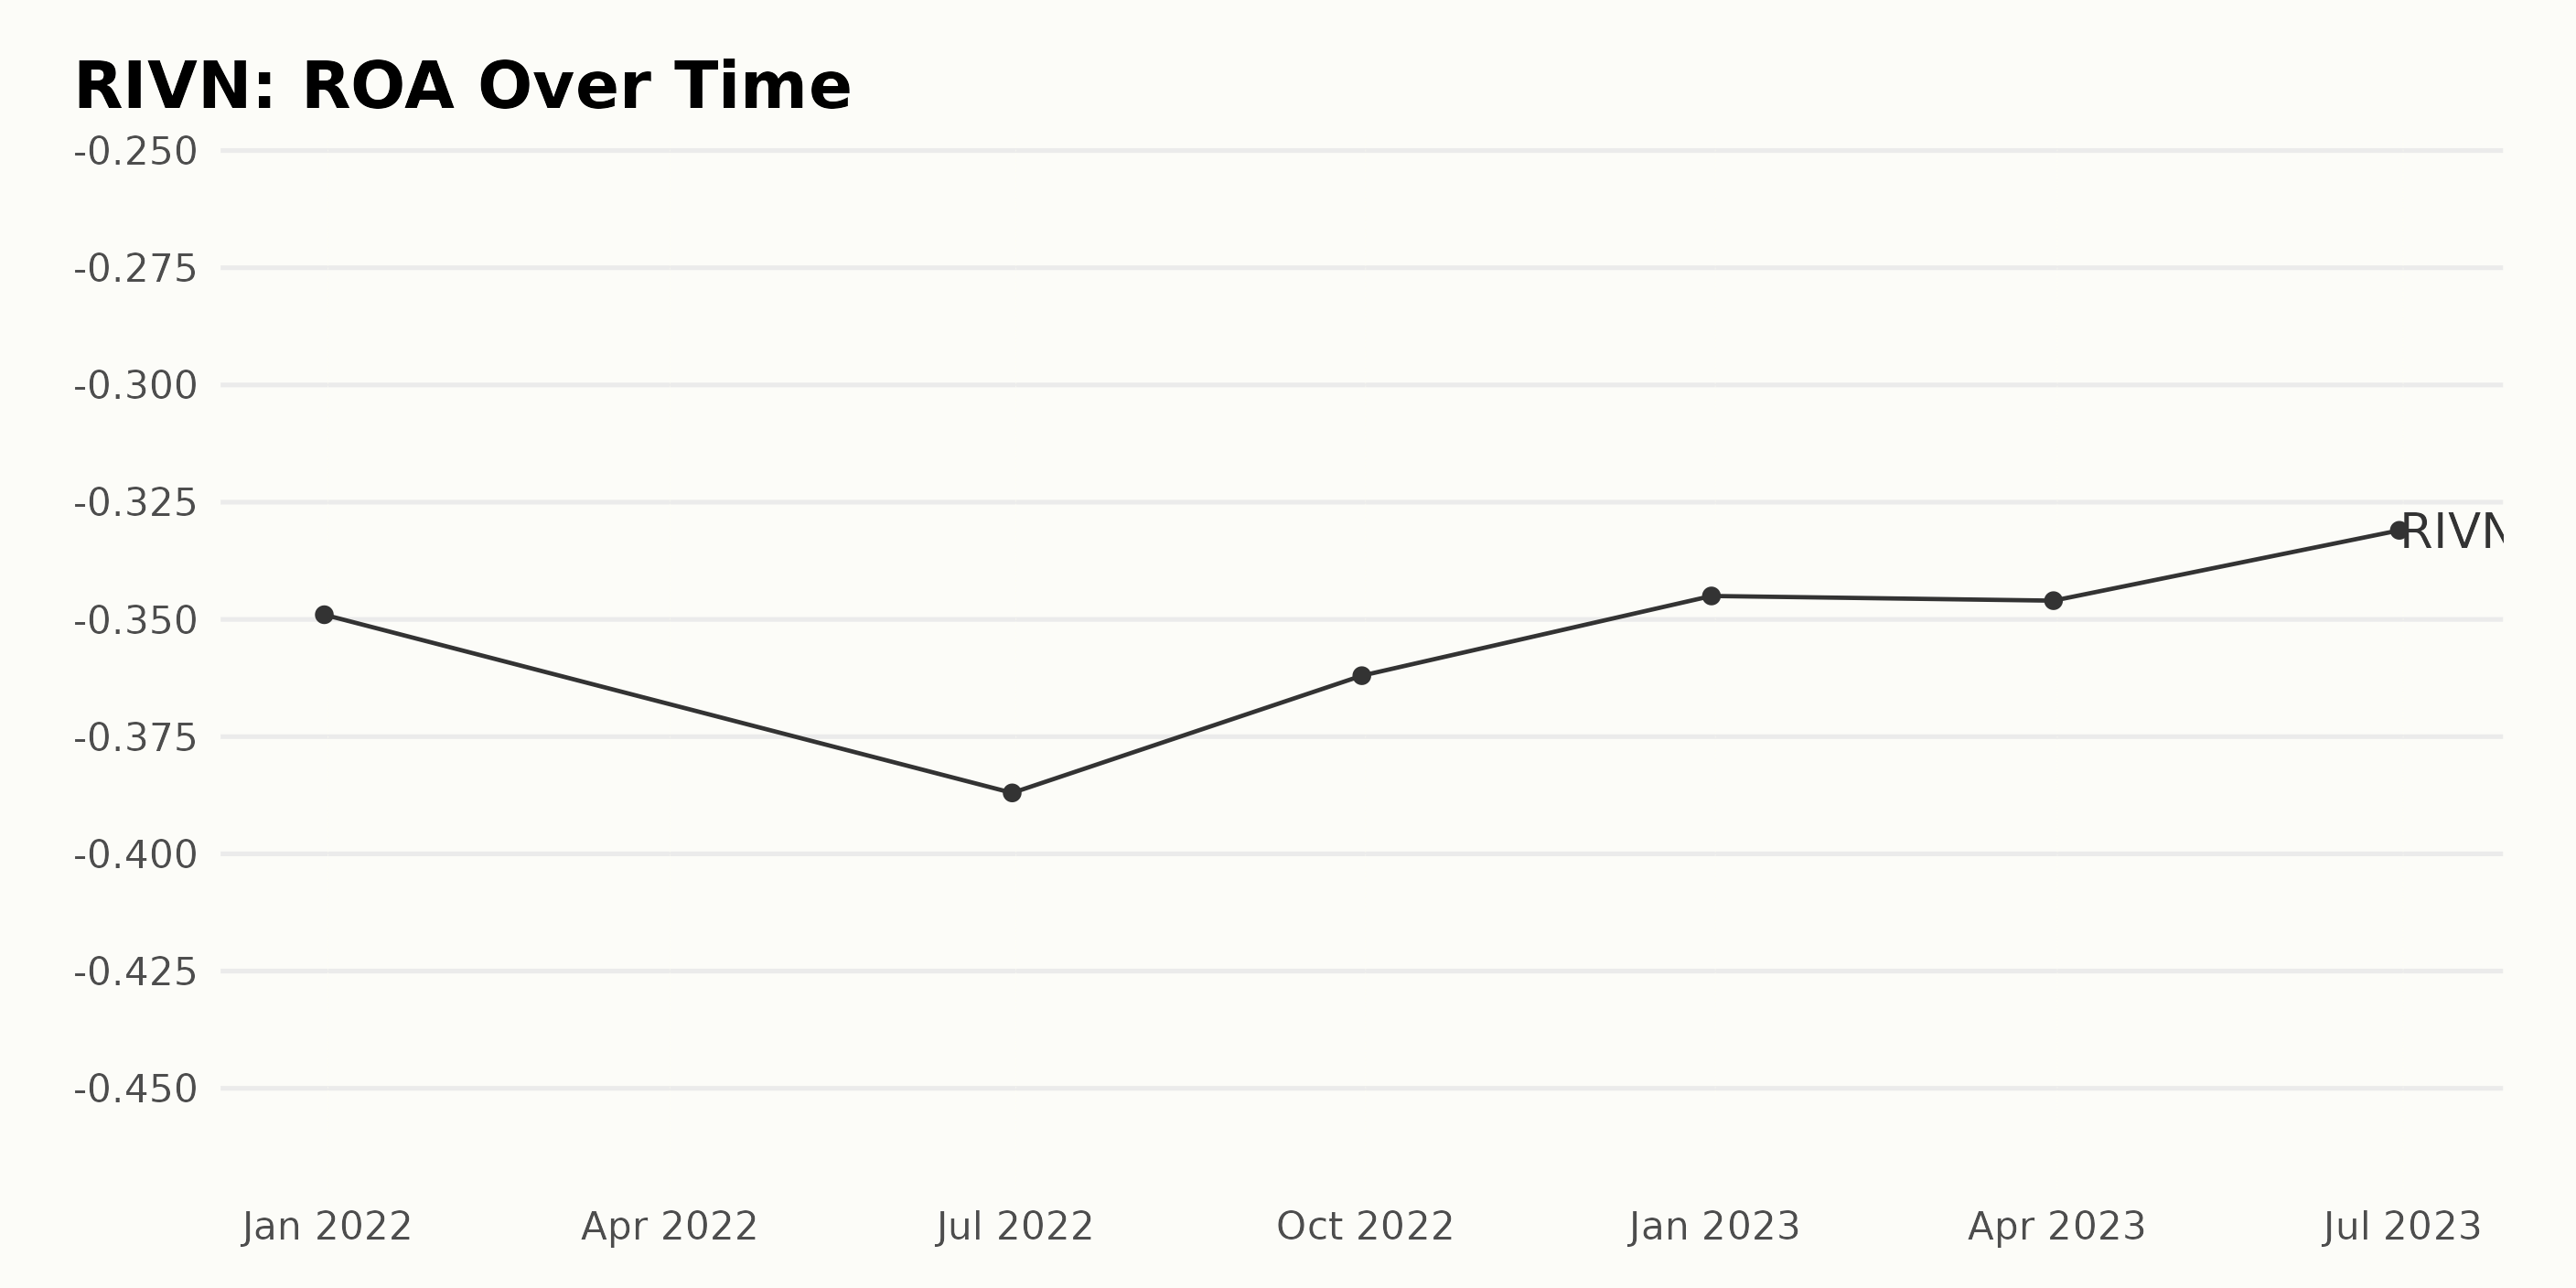
From this data, the reporting found that RIVN's Return On Assets (ROA) exhibits a volatile trend over time.
- From December 31, 2021, at -34.9%, ROA experienced an overall downtrend leading up to June 30, 2022, with a sharper decline to -38.7%.
- A slight recovery took place in the next quarter ending September 30, 2022, where ROA declined less sharply at -36.2%.
- RIVN then reported a more stable decline in ROA rate, with -34.5% being seen at the close of 2022 and -34.6% at the end of the first quarter of 2023.
- The most recent reported ROA from June 30, 2023, showed a relatively better outcome at -33.1%.
When measuring the growth rate from the first value to the last, there is a subtle improvement of around 1.8 percentage points. Despite constant fluctuations, with subtle instances of recovery, it suggests the need for RIVN to augment its asset management strategies to boost its performance in terms of ROA.
The greater emphasis and positive shift in recent data show the possible success of implementing measures for curbing negative returns. However, the still prevalent negative ROA demands persistent efforts in effective resource allocation and utilization by RIVN.
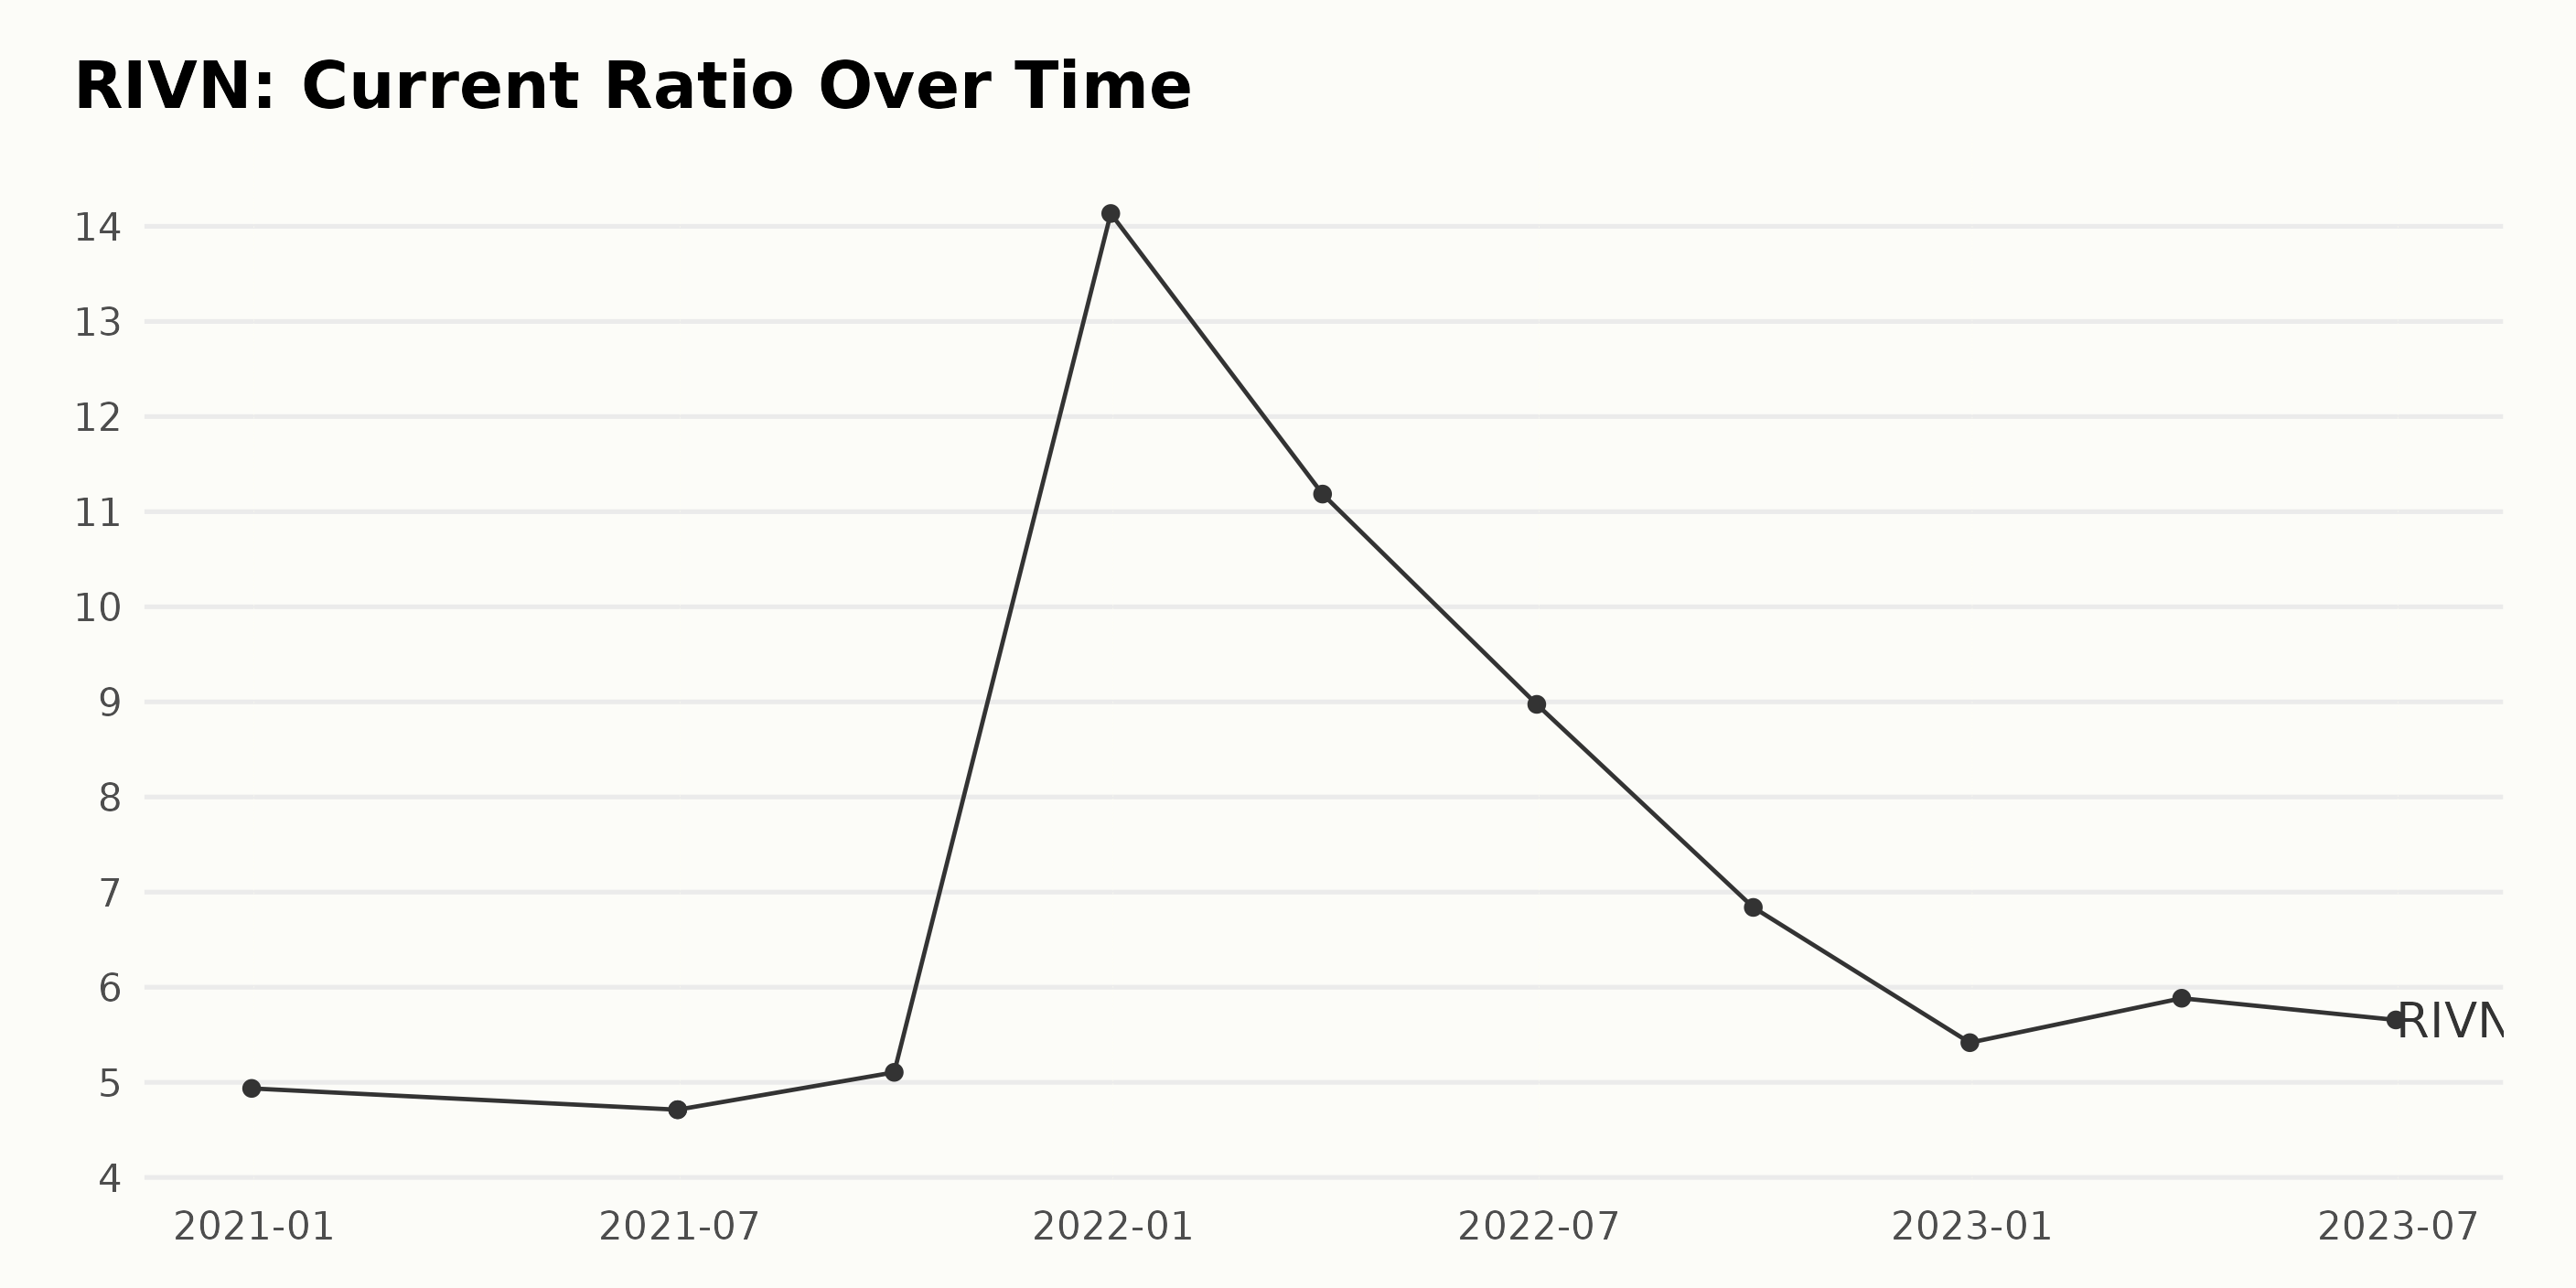
The current ratio of RIVN has demonstrated both trends and fluctuations over the observed period:
- Starting from December 31, 2020, RIVN's current ratio was 4.94.
- The ratio dropped slightly to 4.71 by June 30, 2021. It remained at this level into the next quarter, indicating a period of stability.
- Subsequent to this, an upward trend was witnessed, reaching 5.11 by September 30, 2021.
- A significant leap was seen as the current ratio rose steeply to 14.14 by the end of 2021. However, this did not sustain, and a sharp decrease was then noticed.
- The first three quarters of 2022 saw a continuous decline in the current ratio: 11.19 in March 2022, 8.97 in June 2022, and 6.84 by the end of September 2022. The downward trend proceeded, falling to 5.42 by the close of 2022, which is marginally above the starting value at the end of 2020.
- A short-lived increase happened in early 2023, with the current ratio moving up to 5.88 in March, but it decreased again by June 2023 to 5.66.
- In general, the data displays a growth rate of approximately 15% when comparing the value from December 31, 2020, to June 30, 2023.
Overall, after experiencing some significant fluctuations, the current ratio has returned somewhat close to its original levels, noting a slight overall growth. The most intense fluctuations occurred during the year 2022. The company's liquidity increased significantly towards the end of 2021, only to drop down over the next year and stabilize somewhat higher than the starting point.
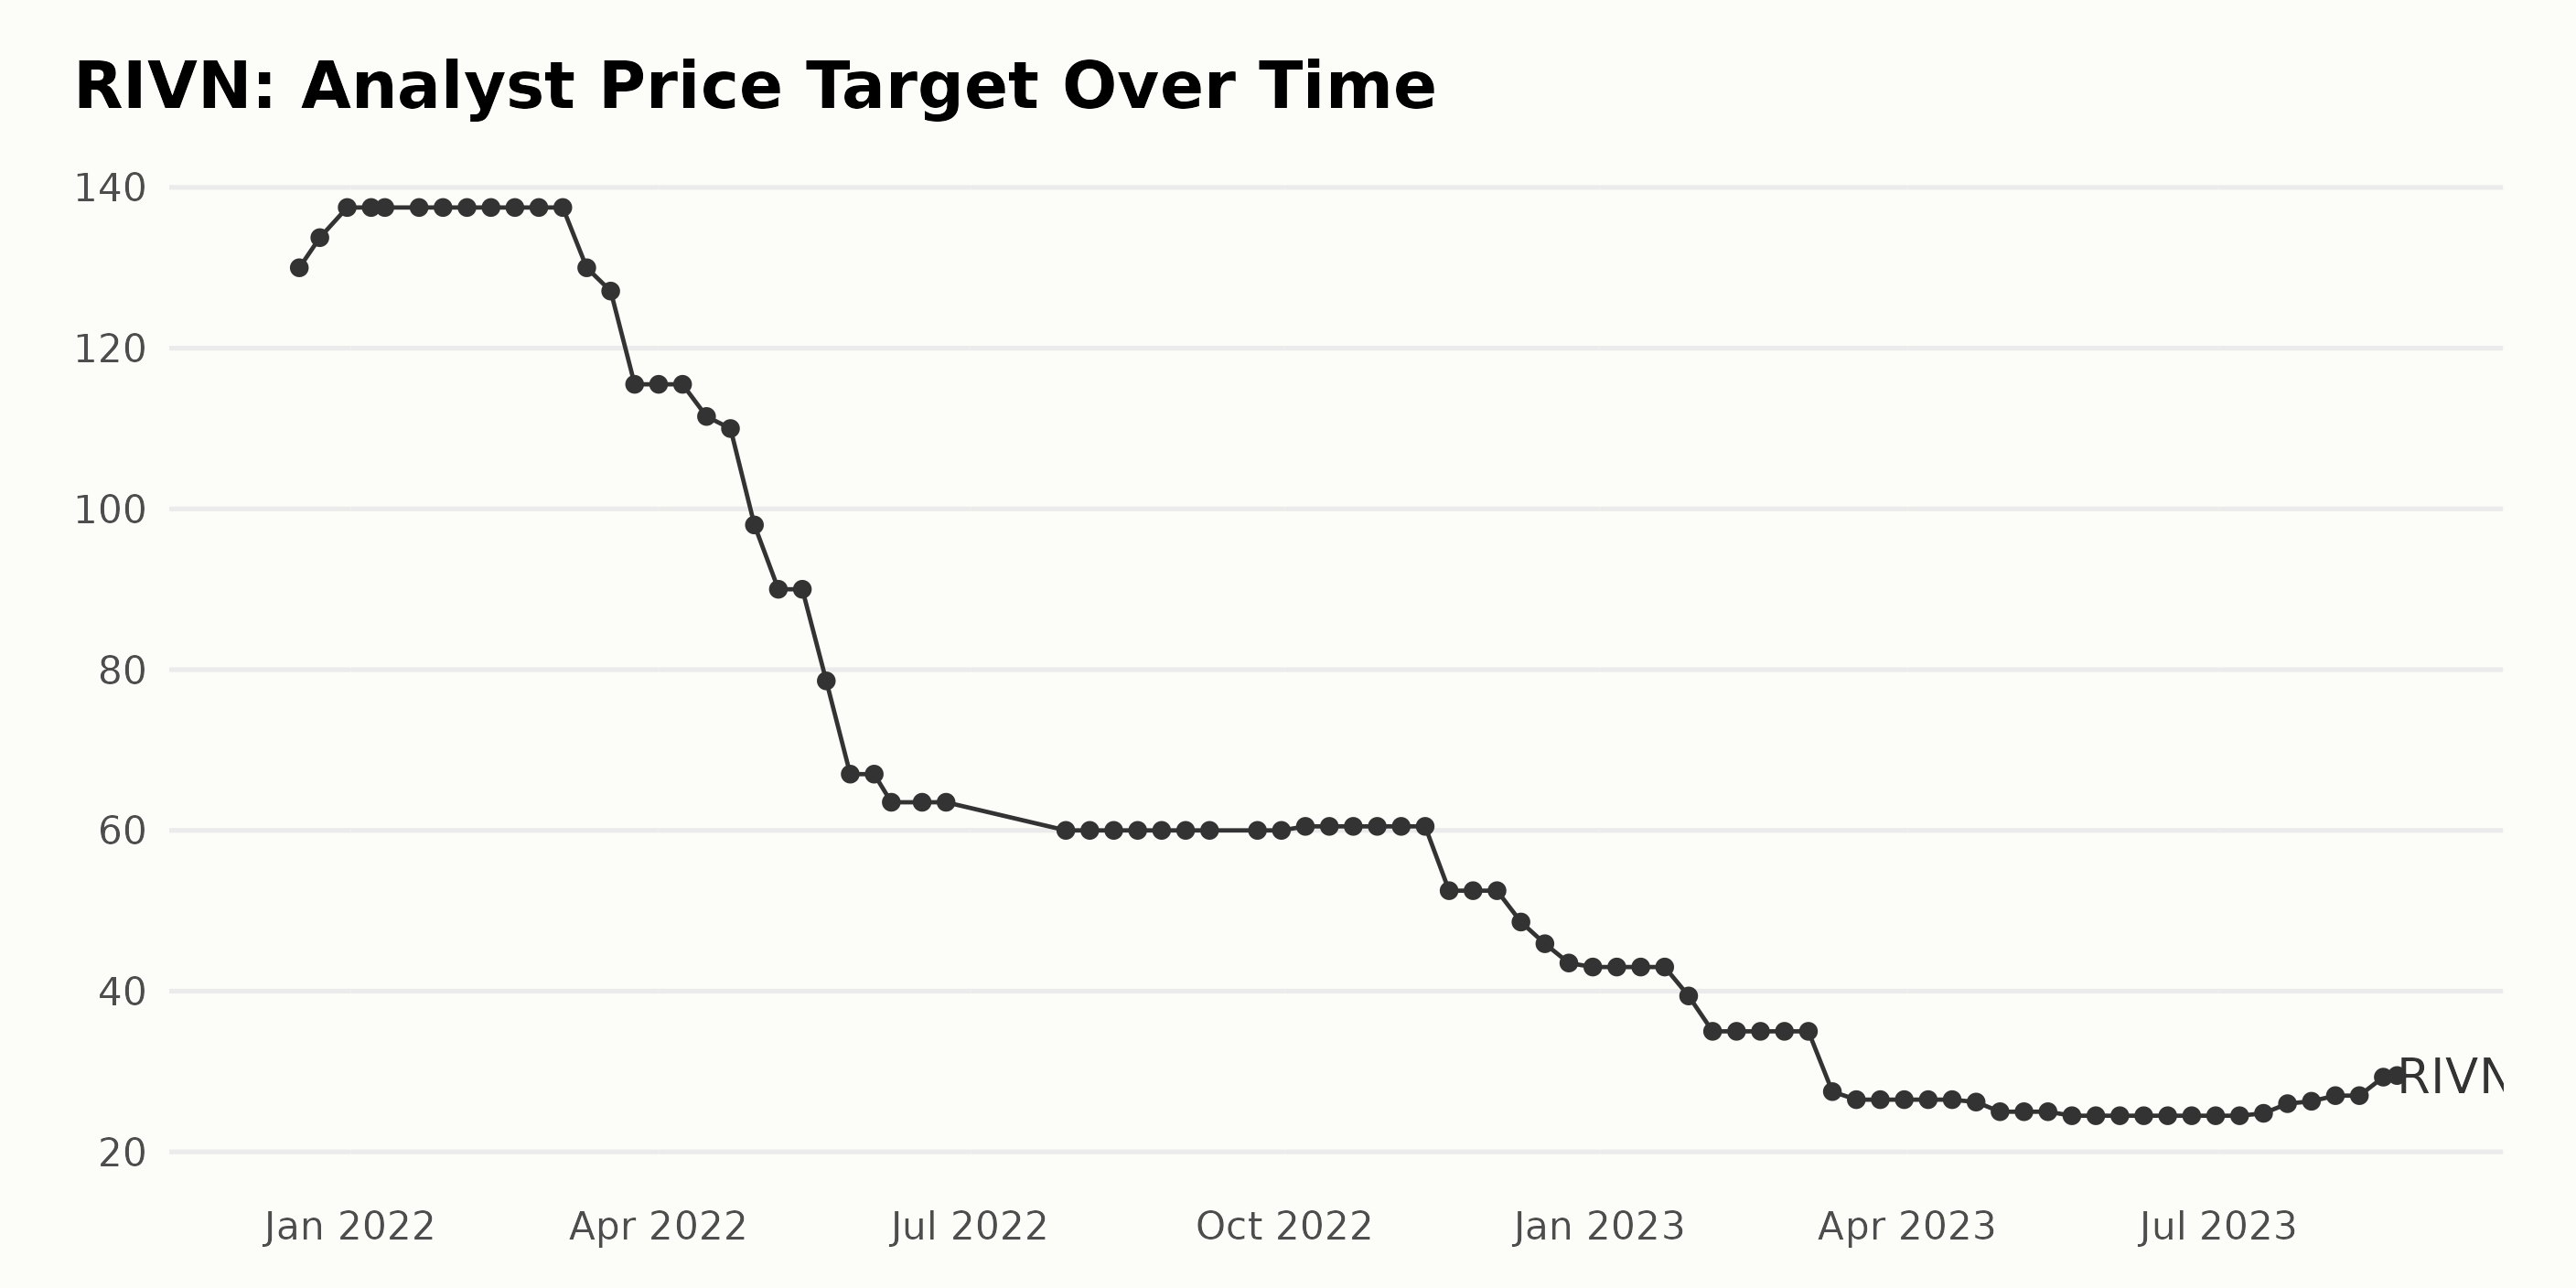
The analyst price target of RIVN showed a significant fluctuating trend over the specific period from December 10, 2021, to August 22, 2023. Summary:
- The analyst price target of RIVN started at a value of $130 on December 17, 2021, and reached a peak of $137.5 by December 31, 2021, maintaining this level until March 2022.
- From March 2022, the price target started to decline steadily, falling to $60 by July 29, 2022, marking around a 56% reduction from the previous peak.
- Throughout August 2022 to October 2022, the price target stayed relatively stable at around $60.5.
- A notable decrease occurred in November 2022, and by the end of December 2022, the price target had dropped to $43.
- From January 2023 to early March 2023, the price target held at $35.
- In mid-March 2023, the price target marked a downward slide, reaching its lowest point at $25 by the end of April 2023.
- Commencing from mid-July 2023, the price target demonstrated an uptick, reaching $29.5 by August 22, 2023.
Overall, from the initial value in December 2021, to the final value in August 2023, the analyst price target has decreased by approximately 77%. Notably, recent data indicates a positive upturn, although the value remains significantly low compared to the starting point. This suggests that the analysts' outlook on the company had become progressively less optimistic over this timeline, with some signs of a modest recovery in mid-2023.
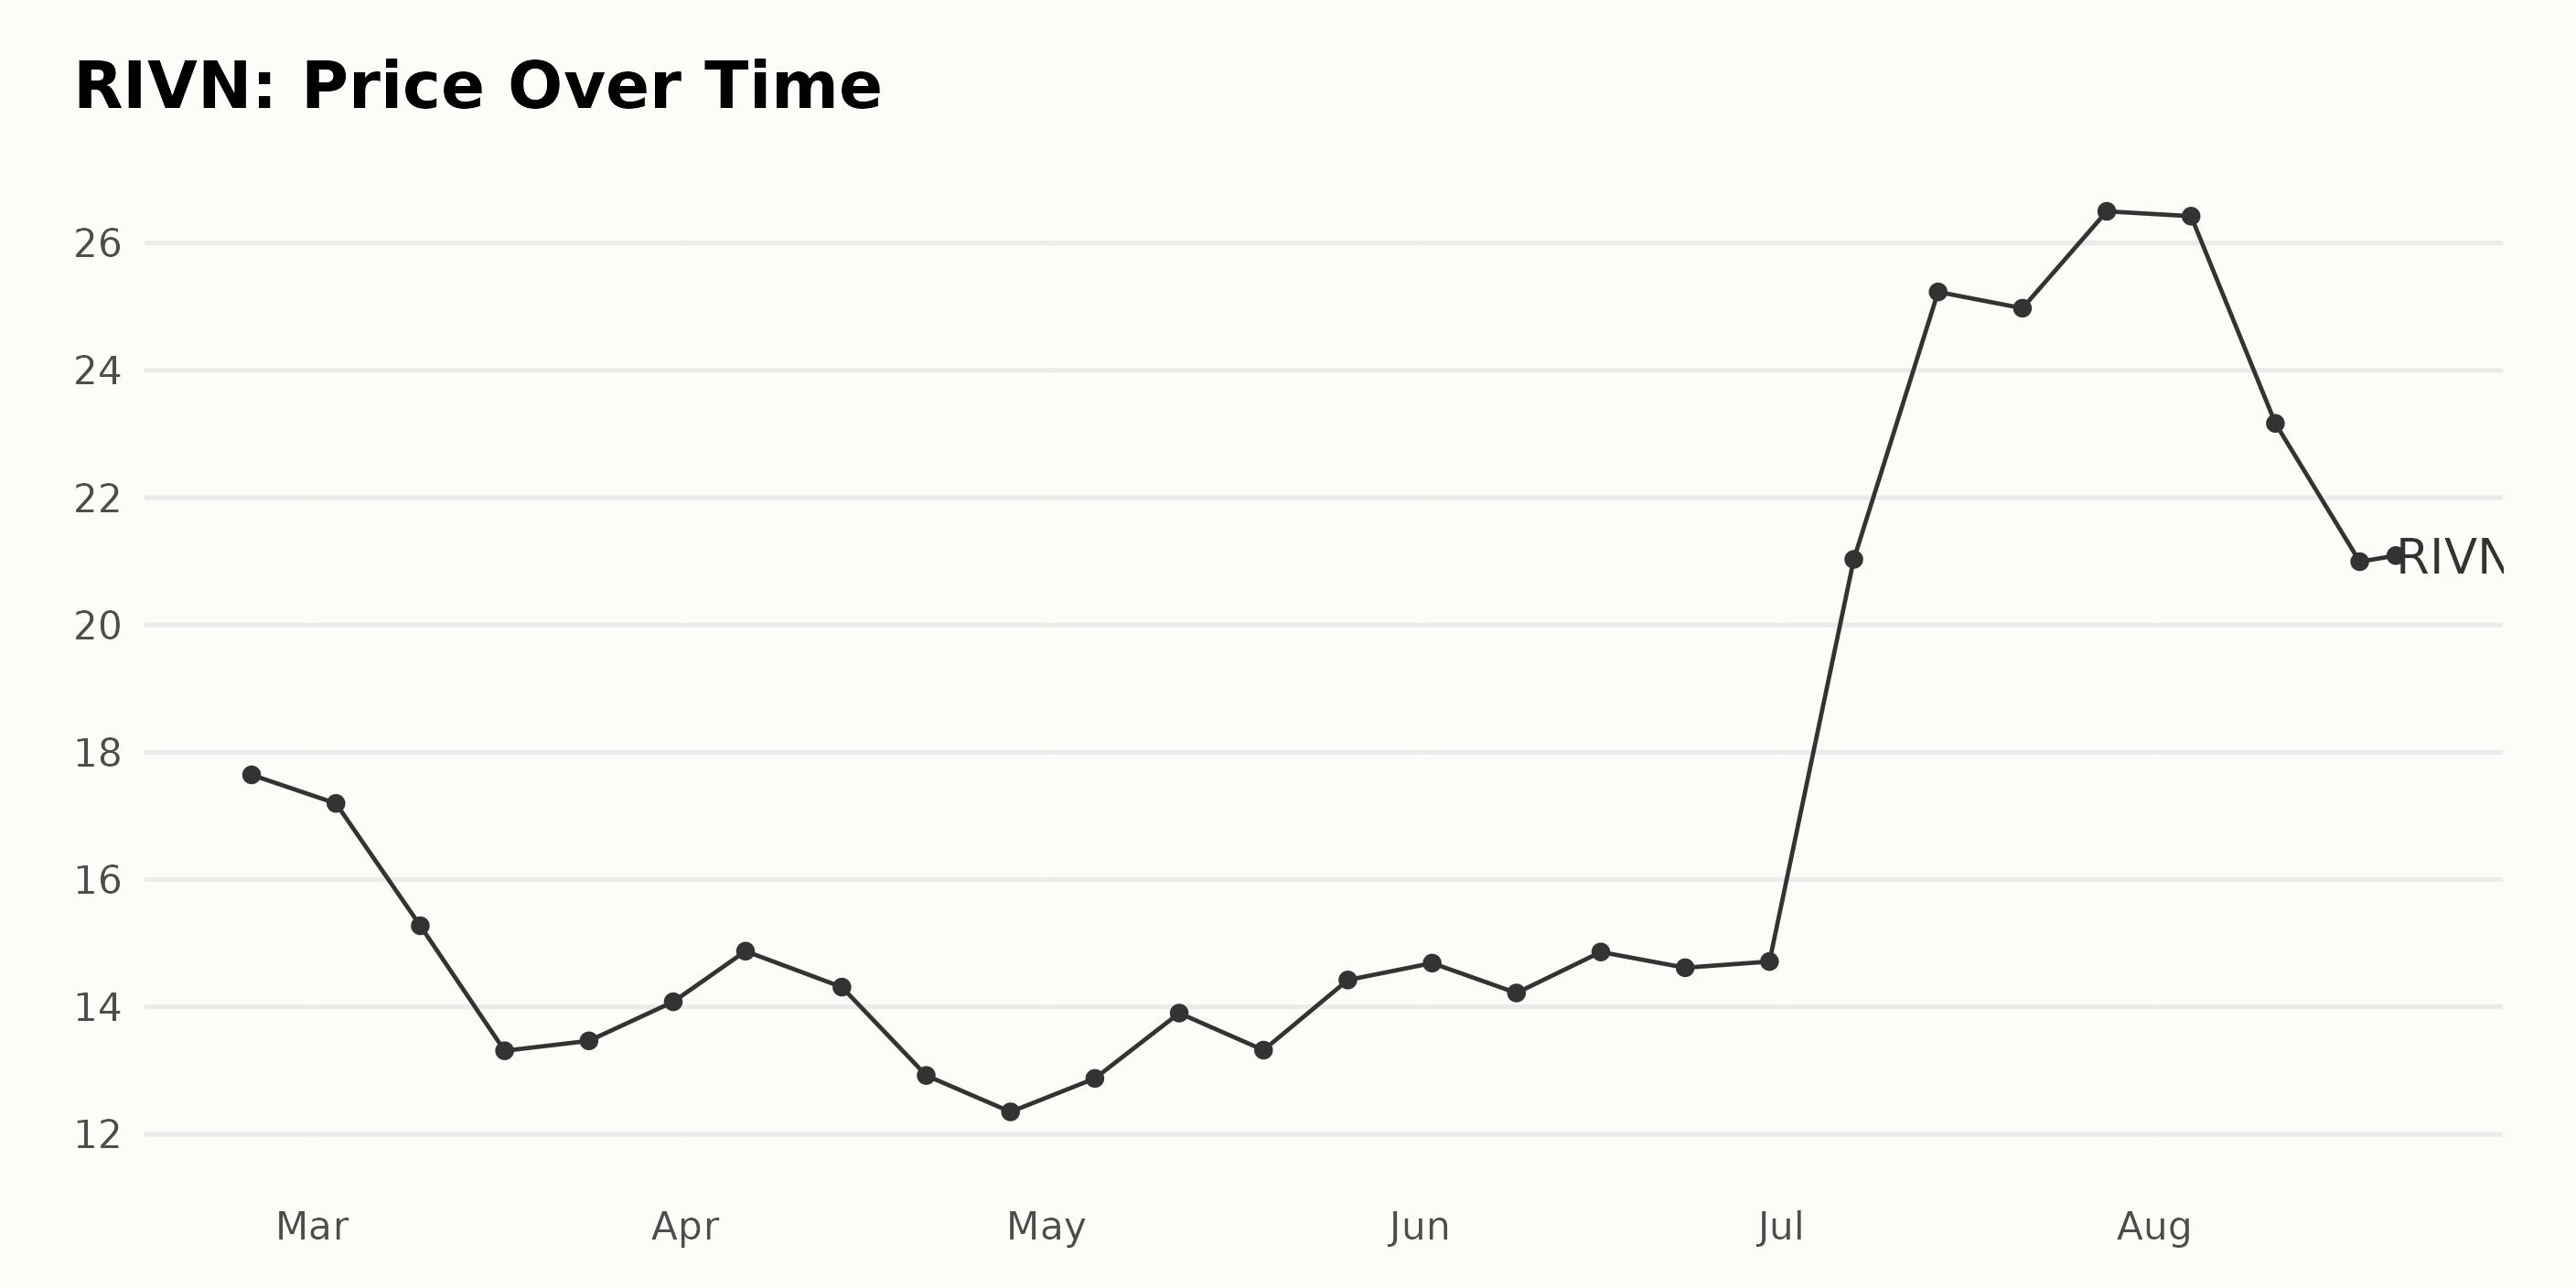
Tracking RIVN's Share Price: An Upward Trend Marred by Fluctuations in 2023
The data for the share price of RIVN reveals an overall trend of significant fluctuation within a generally upward trajectory. Here's the summary:
- The share price started at $17.65 on February 24, 2023, and fell to $13.31 by March 17, 2023.
- There was then a gradual increase until the end of March, reaching up to $14.08.
- In April 2023, the share price varied, starting from $14.88 and making a slight decrease to $12.35 by the end of the month.
- May 2023 saw a slightly more stable growth pattern, with the share price climbing from $12.88 at the beginning of the month to $14.42 at the end.
- Throughout June, the stock price of RIVN hovered around $14, showing a slight increase and ended at $14.71.
- A noticeable surge began in July 2023, with the share price jumping to $21.03 in the first week. This upward trend was sustained throughout the month, peaking at $26.50 by the end of the month.
- August started strong with a price of $26.42 but then declined notably to $20.99 by August 18, 2023. However, the data set ends with a slight rebound to $21.18 on August 21, 2023.
In terms of growth rate, a clear and accelerating trend is visible from July 2023 onwards, albeit with some deceleration towards the middle of August 2023. Here is a chart of RIVN's price over the past 180 days.
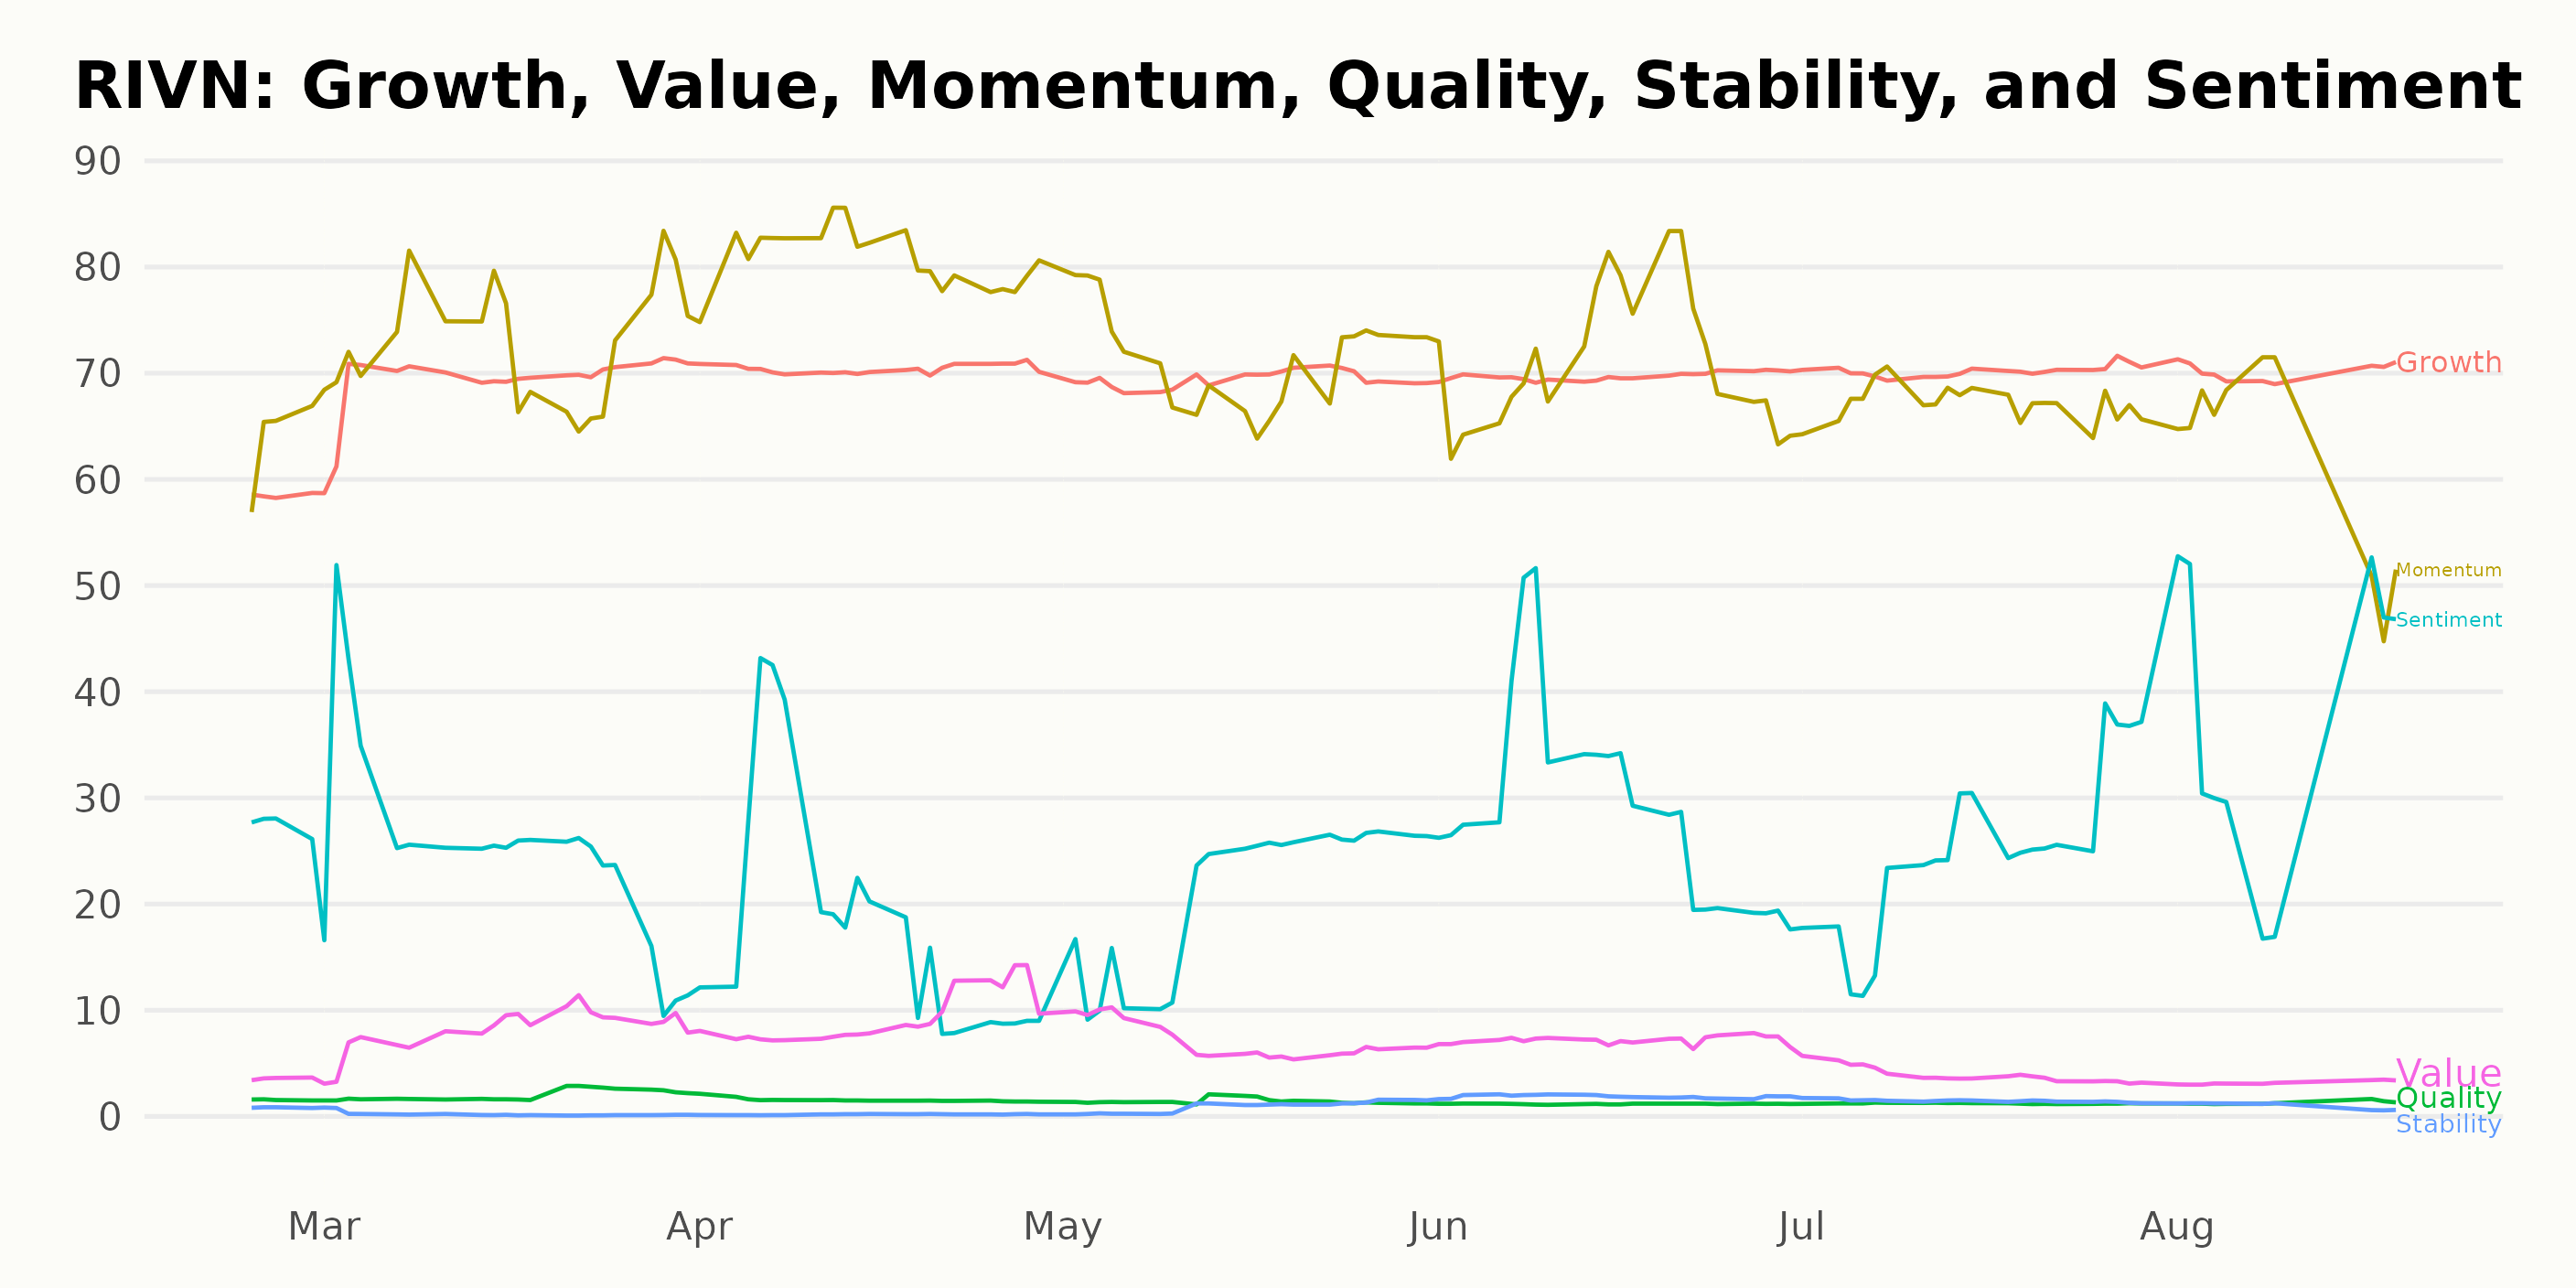
Analyzing RIVN's 2023 Performance: Growth, Momentum, and Sentiment Trends Unveiled
Based on the data provided, RIVN's POWR Ratings grade can be discussed as follows:
Throughout the period from February 25, 2023, to August 22, 2023, RIVN consistently received an F (Strong Sell) POWR grade. This suggests that its performance across various parameters was not satisfactory during this time span.
Regarding its rank in the Auto & Vehicle Manufacturers category, RIVN's ranking fluctuated within the range of #52 to #44, ranking out of the total 55 stocks in this category.
As of the latest data point, dated August 22, 2023, RIVN had an F (Strong Sell) POWR grade and ranked #45 in its category. Here's a summary of RIVN's POWR grade and ranking in its category across some key time points:
- February 2023: POWR Grade - F, Rank in Category - #52
- April 2023: POWR Grade - F, Rank in Category - #47
- June 2023: POWR Grade - F, Rank in Category - #49
- August 2023: POWR Grade - F, Rank in Category - #45
The fact that RIVN has maintained a uniform POWR grade of F (Strong Sell) and has not shown significant movement in terms of rank within its category suggests that the stock's performance and potential might not have been favorable during this referenced period.
After examining the POWR Ratings for RIVN, the three dimensions of primary interest are Growth, Momentum, and Sentiment.
Growth: The Growth dimension of RIVN shows a mostly stable trend throughout the year 2023. Starting with a score of 58 in February 2023, the Growth score experiences an upward move peaking at 70 in April 2023. Despite slight fluctuations thereafter, it retains a score of around 70 through August 2023.
Momentum: The Momentum score also shows an upward trend during the early months of 2023. It begins at a value of 64 in February and rises to peak at 81 in April 2023. Following this high point, the Momentum score sees a gradual decline to 62 by August 2023.
Sentiment: In contrast to the first two dimensions, the Sentiment score demonstrates volatility throughout the covered period, with values ranging from 18 to 37. It starts at a relatively higher level of 27 in February 2023 but then declines to 18 in April 2023, the lowest point within this period. Subsequently, its highest score of 37 was achieved in August 2023, indicating a fluctuating Sentiment trend for RIVN during this time.
How does Rivian Automotive, Inc. (RIVN) Stack Up Against its Peers?
Other stocks in the Auto & Vehicle Manufacturers sector that may be worth considering are Honda Motor Co., Ltd. (HMC), Stellantis N.V. (STLA), and Isuzu Motors Limited (ISUZY) - they have better POWR Ratings.
What To Do Next?
Get your hands on this special report with 3 low priced companies with tremendous upside potential even in today’s volatile markets:
3 Stocks to DOUBLE This Year >
RIVN shares were trading at $20.56 per share on Tuesday morning, down $0.62 (-2.93%). Year-to-date, RIVN has gained 11.56%, versus a 15.76% rise in the benchmark S&P 500 index during the same period.
About the Author: Anushka Dutta

Anushka is an analyst whose interest in understanding the impact of broader economic changes on financial markets motivated her to pursue a career in investment research.
The post How Should Traders Approach Rivian Automotive (RIVN)? appeared first on StockNews.com