


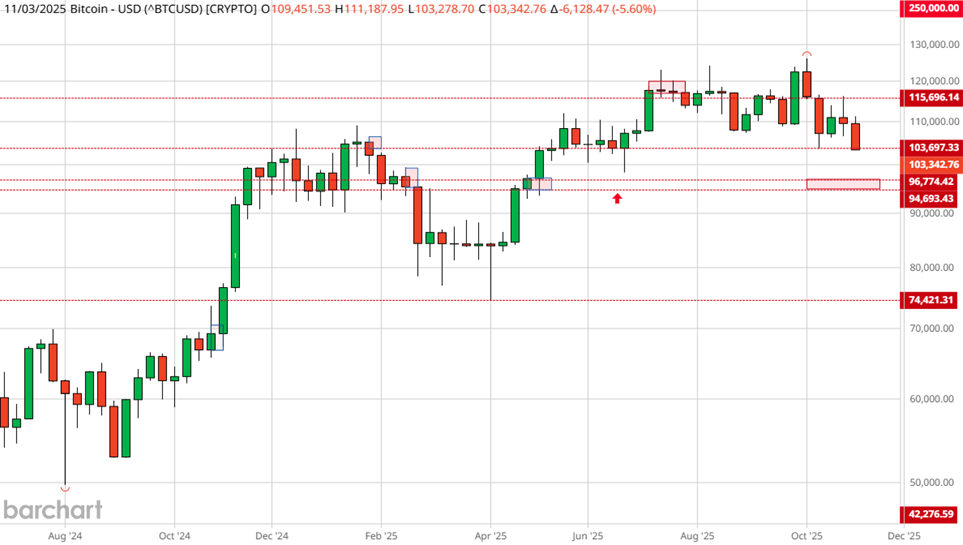
From an auction market perspective, Bitcoin’s (BTCUSD) recent behavior on the weekly chart carries the hallmarks of a failed auction. In this technical condition, price extends beyond a prior value area but fails to attract sufficient participation or volume to sustain the move.
In simple terms, the market explored higher prices but found no willing buyers to maintain value at those levels, and has since begun to retreat back into its previous range. This lack of acceptance above the breakout zone suggests rejection rather than confirmation, a subtle yet powerful signal that the uptrend’s structural integrity may be weakening.
Trend analyses tell us that higher time frames influence lower time frames. However, trend changes are often influenced by price reversal sentiment and clusters of recurring evidence at lower time frames before being confirmed by higher time frames.
Shifting to a daily perspective, several interesting technical clues seem to bear out that the price action of Bitcoin is changing character.
Key Clues from the Daily BTC Chart
Looking from left to right, arrow #1 identifies two key points. First, a dragonfly doji, signifying a battle between buyer and seller where the price penetrated deeply, but was pushed back higher. Often, these types of candlesticks can control or dictate new levels of support/resistance, as seen at arrow #4.
Additionally, long upper and lower shadows/wicks can point to untested levels of support and resistance.
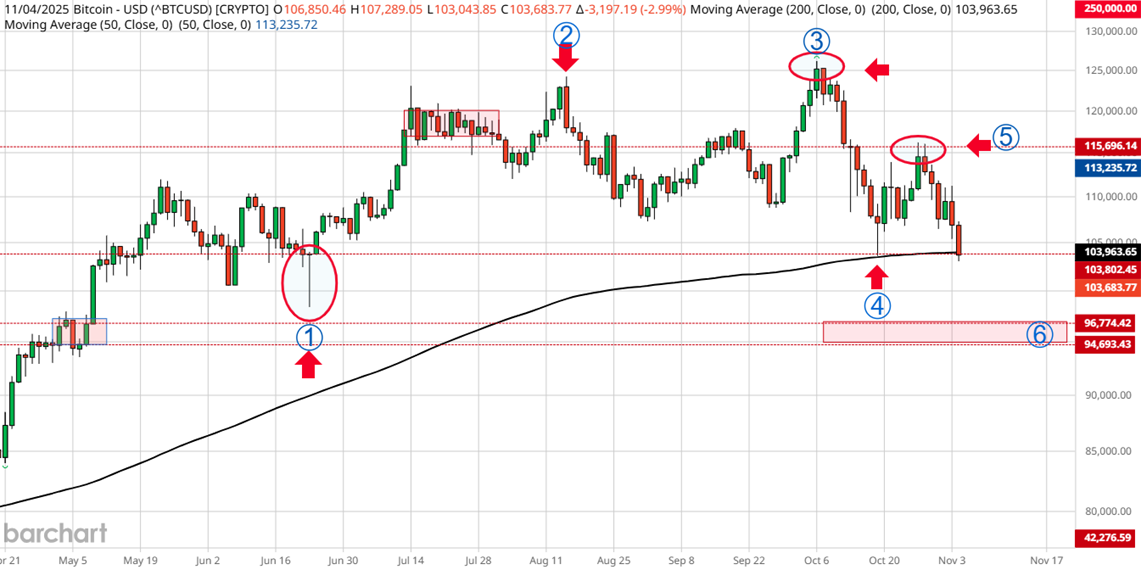
Moving from arrow #1 to #2, the market sets about making a new all-time high (ATH) for Bitcoin, followed by a minor correction, which creates a new higher low, and then attempts to make another new ATH, arrow #3. Momentum quickly stalls, and participation has not expanded to confirm a higher value. Price quickly retreats to retest the origin of the last up leg, arrow #1, establishing a new trading range.
Bitcoin gathers itself once again and rallies but fails to recapture half of the new trading range, arrow #5, which corresponds with the 50-day moving average. Now it finds itself back at this critical level of support, arrow #4, and coincidentally, the 200-day moving average.
What the ADX Tells Us
Other reinforcing evidence can be seen on this chart, highlighting the Average Directional Index (ADX) indicator, which is about to cross 20 – a confirmation sign of a developing trend, as the -Di line rises above 25.
Paired with the Relative Strength Index (RSI) penetrating below 40, this is a clear sign that the previous uptrend has been compromised.

The Real Risk for Bitcoin Traders & Investors Here
Failure to hold the 200-day moving average level on a weekly closing basis should trigger a liquidity sweep to the highlighted demand zone #6. If the price closes decisively back below the prior breakout zone, it will confirm a failed auction and open the door to a broader correction, one that could unwind months of speculative gains.
For traders and investors, the risk is not in missing the next leg higher, but in ignoring the early signs of market acceptance failure that often precede a meaningful trend reversal.
– John Rowland, CMT, is Barchart’s Senior Market Strategist and host of Market on Close.
On the date of publication, Barchart Insights did not have (either directly or indirectly) positions in any of the securities mentioned in this article. All information and data in this article is solely for informational purposes. For more information please view the Barchart Disclosure Policy here.
More news from Barchart
- Jane Street Is Buying Up Cipher Mining Stock. Should You Grab CIFR Shares Here?
- Bitcoin’s Weekly Structure Shows Signs of a Failed Auction. It’s a Warning for the Long-Term Trend.
- Core Scientific Just Got a New Street-High Price Target. Should You Buy CORZ Stock Here?
- Bitcoin Whales Are Swimming Into ETFs. This Could Transform Crypto or End Up a Jagged Little Pill.


