


Continued global momentum, partially offset by US performance, delivered mid-single digit top- and bottom-line growth
AB InBev (Brussel:ABI) (BMV:ANB) (JSE:ANH) (NYSE: BUD):
This press release features multimedia. View the full release here: https://www.businesswire.com/news/home/20231030866670/en/
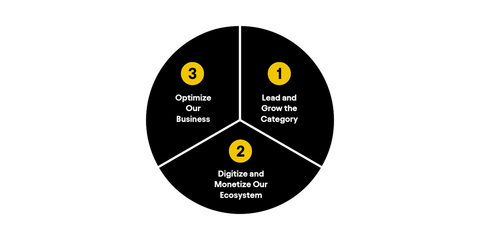
ABI Strategic Priorities (Graphic: Business Wire)
Regulated and inside information1
��The strength of our global footprint delivered another quarter of top- and bottom-line growth. Revenue increased by 5.0% with an EBITDA increase of 4.1%. We continue to invest in our strategic priorities for the long-term.” – Michel Doukeris, CEO, AB InBev
Total Revenue +5.0% Revenue increased by 5.0% in 3Q23 with revenue per hl growth of 9.0% and by 8.3% in 9M23 with revenue per hl growth of 10.1% .
15.1% increase in combined revenues of our global brands, Budweiser, Stella Artois, Corona and Michelob Ultra, outside of their respective home markets in 3Q23, and 16.2% in 9M23.
Approximately 66% of our revenue through B2B digital platforms with the monthly active user base of BEES reaching 3.4 million users.
Over 125 million USD of revenue generated by our digital direct-to-consumer ecosystem.
Total Volume -3.4% In 3Q23, total volumes declined by 3.4%, with own beer volumes down by 4.0% and non-beer volumes up by 1.4%. In 9M23, total volumes declined by 1.4% with own beer volumes down by 1.9% and non-beer volumes up by 1.8%.
Normalized EBITDA +4.1% In 3Q23, normalized EBITDA increased by 4.1% to 5 431 million USD with a normalized EBITDA margin contraction of 29 bps to 34.9%. In 9M23, normalized EBITDA increased by 7.3% to 15 099 million USD and normalized EBITDA margin contracted by 31 bps to 33.6%. Normalized EBITDA figures of 9M22 include an impact of 201 million USD from tax credits in Brazil. |
Underlying Profit 1 735 million USD Underlying profit (profit attributable to equity holders of AB InBev excluding non-underlying items and the impact of hyperinflation) was 1 735 million USD in 3Q23 compared to 1 682 million USD in 3Q22 and was 4 497 million USD in 9M23 compared to 4 354 million USD in 9M22.
Underlying EPS 0.86 USD Underlying EPS was 0.86 USD in 3Q23, an increase from 0.84 USD in 3Q22 and was 2.23 USD in 9M23, an increase from 2.16 USD in 9M22.
Capital Allocation 3 billion USD Debt redemption 1 billion USD Share buyback program
The company has approved a cash tender offer for up to 3 billion USD in aggregate purchase price of outstanding bonds and the AB InBev Board of Directors has approved a 1 billion USD share buyback program to be executed within the next 12 months. For further details please see the Recent Events section on page 13. |
1The enclosed information constitutes inside information as defined in Regulation (EU) No 596/2014 of the European Parliament and of the Council of 16 April 2014 on market abuse, and regulated information as defined in the Belgian Royal Decree of 14 November 2007 regarding the duties of issuers of financial instruments which have been admitted for trading on a regulated market. For important disclaimers and notes on the basis of preparation, please refer to page 14. |
Management comments
Continued global momentum, partially offset by US performance, delivered mid-single digit top- and bottom-line growth
We delivered a top-line increase of 5.0%, with revenue growth in approximately 80% of our markets, driven by a revenue per hl increase of 9.0% as a result of pricing actions, ongoing premiumization and other revenue management initiatives. Volumes declined by 3.4%, as growth in our Middle Americas, Africa and APAC regions was primarily offset by performance in the US and a soft industry in Europe. EBITDA increased by 4.1% with margin compression of 29bps, as disciplined overhead management and efficient resource allocation enabled increased sales and marketing investments and partially offset anticipated commodity cost headwinds. Underlying EPS was 0.86 USD.
Progressing our strategic priorities
We continue to execute on and invest in three key strategic pillars to deliver consistent growth and long-term value creation.
Lead and grow the category:
This quarter we delivered revenue growth in approximately 80% of our markets.
Digitize and monetize our ecosystem:
BEES captured approximately 10.4 billion USD of gross merchandise value (GMV), a 27% increase versus 3Q22 with 66% of our revenue through B2B digital channels. BEES Marketplace is live in 15 markets and generated an annualized GMV of approximately 1.7 billion USD with 65% of BEES customers now also Marketplace buyers.
Optimize our business:
We continue to focus on deleveraging and have approved a cash tender offer for up to 3 billion USD in aggregate purchase price of outstanding bonds. In addition, as part of our objective to maximize value creation, the AB InBev Board of Directors has approved a 1 billion USD share buyback program to be executed within the next 12 months.
Lead and grow the category
Driven by our portfolio of megabrands, we are executing on our five proven and scalable levers to drive category expansion:
- Category Participation: In 3Q23, the percentage of consumers purchasing our portfolio of brands increased or remained stable in the majority of our markets, according to our estimates. Participation increases this quarter were led by female consumers across key markets in Africa and Europe.
- Core Superiority: In 3Q23, our mainstream portfolio delivered a mid-single digit revenue increase as double-digit growth in South Africa, Colombia and the Dominican Republic was partially offset by the revenue decline of Bud Light in the US. Our mainstream brands gained or maintained share of segment in the majority of our key markets, according to our estimates.
- Occasions Development: Our global no-alcohol beer portfolio delivered over 10% revenue growth this quarter, with our performance driven by Budweiser Zero in Brazil and growth of Corona Cero in Canada, Mexico and Europe. Leveraging our digital direct-to-consumer products we are developing new consumer insights and consumption occasions. For example, across Latin America, Zé Delivery and TaDa are enabling increased in-home consumption of returnable glass bottle packs by increasing availability and convenience.
- Premiumization: Our above core beer portfolio grew revenue by high-single digits in 3Q23 led by our global brands which grew revenue by 15.1% outside of their home markets. Corona delivered a revenue increase of 18.8%, Budweiser grew by 11.8%, Stella Artois by 20.3% and Michelob Ultra by 11.5%.
- Beyond Beer: Our global Beyond Beer business contributed approximately 385 million USD of revenue in the quarter, a mid-single digit increase versus 3Q22, as growth globally was partially offset by a soft malt-based seltzer industry in the US. Global growth was primarily driven by the expansion of Flying Fish in Africa and the Vicky portfolio in Mexico.
Digitize and monetize our ecosystem
-
Digitizing our relationships with more than 6 million customers globally: As of 30 September 2023, BEES is live in 25 markets with approximately 66% of our 3Q23 revenues captured through B2B digital platforms. In 3Q23, BEES had 3.4 million monthly active users and captured approximately 10.4 billion USD in gross merchandise value (GMV), growth of 11% and 27% versus 3Q22 respectively.
BEES Marketplace is live in 15 markets with 65% of BEES customers also marketplace buyers. Marketplace captured approximately 420 million USD in GMV from sales of third-party products this quarter, growth of 52% versus 3Q22.
- Leading the way in DTC solutions: Our omnichannel direct-to-consumer (DTC) ecosystem of digital and physical products generated revenue of more than 390 million USD in 3Q23. Our DTC megabrands, Zé Delivery, TaDa and PerfectDraft are available in 21 markets, generated 16.9 million ecommerce orders and delivered over 125 million USD in revenue this quarter, representing 9% growth versus 3Q22.
Optimize our business
-
Maximizing value creation: The objective of our dynamic capital allocation priorities is to maximize value creation to our shareholders. We continue to proactively manage our debt portfolio and have approved a cash tender offer for up to 3 billion USD in aggregate purchase price of outstanding bonds. In addition, as a result of our continued global momentum and strong free cash flow generation, the AB InBev Board of Directors has approved a 1 billion USD share buyback program to be executed within the next 12 months. Our Underlying EPS was 0.86 USD this quarter, an increase of 0.02 USD per share versus 3Q22, driven by nominal EBITDA growth and continued optimization of our net finance costs.
For further details on the cash tender offer and share buyback program please refer to the Recent Events section on page 13.
- Advancing our sustainability priorities: We continued to innovate and make progress towards our 2025 Sustainability Goals through key local initiatives with the potential to scale globally. For Climate Action, to support our Scope 3 efforts, we organized supplier collaboration and training events across our key markets. In Sustainable Agriculture, we hosted more than 200 farmers at our annual grower day in the US to share results from our barley variety and crop management research trials. In Water Stewardship, we launched a partnership with WaterAid in Ghana for a solar-powered water delivery system to help advance the delivery of clean and safe water to communities in need. For Circular Packaging, we continued to scale our program in Mexico to recover bottles destined for landfill, recovering more than 145 million bottles during 3Q23.
Creating a future with more cheers
In 9M23, we delivered 8.3% revenue growth, with a 10.1% revenue per hl increase, and 7.3% EBITDA growth while continuing to invest for the long-term in our brands, capacity and digital transformation. The beer category is large and growing, and our unique global leadership advantages, replicable growth drivers and superior profitability position us well to generate value for our stakeholders and deliver on our purpose to create a future with more cheers.
2023 Outlook
(i) |
|
Overall Performance: We expect our EBITDA to grow in line with our medium-term outlook of between 4-8% and our revenue to grow ahead of EBITDA from a healthy combination of volume and price. The outlook for FY23 reflects our current assessment of inflation and other macroeconomic conditions. |
(ii) |
|
Net Finance Costs: Net pension interest expenses and accretion expenses are expected to be in the range of 200 to 230 million USD per quarter, depending on currency and interest rate fluctuations. We expect the average gross debt coupon in FY23 to be approximately 4%. |
(iii) |
|
Effective Tax Rates (ETR): We expect the normalized ETR in FY23 to be in the range of 27% to 29%. The ETR outlook does not consider the impact of potential future changes in legislation. |
(iv) |
|
Net Capital Expenditure: We expect net capital expenditure of between 4.5 and 5.0 billion USD in FY23. |
Figure 1. Consolidated performance (million USD) |
|||
3Q22 |
3Q23 |
Organic |
|
growth |
|||
Total Volumes (thousand hls) |
157 284 |
151 891 |
-3.4% |
AB InBev own beer |
137 796 |
132 325 |
-4.0% |
Non-beer volumes |
18 332 |
18 589 |
1.4% |
Third party products |
1 156 |
977 |
-14.2% |
Revenue |
15 091 |
15 574 |
5.0% |
Gross profit |
8 232 |
8 394 |
4.1% |
Gross margin |
54.5% |
53.9% |
-44 bps |
Normalized EBITDA |
5 313 |
5 431 |
4.1% |
Normalized EBITDA margin |
35.2% |
34.9% |
-29 bps |
Normalized EBIT |
4 055 |
4 027 |
2.7% |
Normalized EBIT margin |
26.9% |
25.9% |
-57 bps |
|
|||
Profit attributable to equity holders of AB InBev |
1 433 |
1 472 |
|
Underlying profit attributable to equity holders of AB InBev |
1 682 |
1 735 |
|
|
|||
Earnings per share (USD) |
0.71 |
0.73 |
|
Underlying earnings per share (USD) |
0.84 |
0.86 |
|
9M22 |
9M23 |
Organic |
|
growth |
|||
Total Volumes (thousand hls) |
446 358 |
440 021 |
-1.4% |
AB InBev own beer |
389 488 |
382 135 |
-1.9% |
Non-beer volumes |
53 820 |
54 812 |
1.8% |
Third party products |
3 050 |
3 075 |
2.4% |
Revenue |
43 118 |
44 907 |
8.3% |
Gross profit |
23 475 |
24 190 |
7.2% |
Gross margin |
54.4% |
53.9% |
-55 bps |
Normalized EBITDA |
14 896 |
15 099 |
7.3% |
Normalized EBITDA margin |
34.5% |
33.6% |
-31 bps |
Normalized EBIT |
11 160 |
11 099 |
6.2% |
Normalized EBIT margin |
25.9% |
24.7% |
-48 bps |
|
|||
Profit attributable to equity holders of AB InBev |
3 126 |
3 450 |
|
Underlying profit attributable to equity holders of AB InBev |
4 354 |
4 497 |
|
|
|||
Earnings per share (USD) |
1.55 |
1.71 |
|
Underlying earnings per share (USD) |
2.16 |
2.23 |
|
Figure 2. Volumes (thousand hls) |
||||||
3Q22 |
Scope |
Organic |
3Q23 |
Organic growth |
||
growth |
Total |
Own beer |
||||
North America |
27 775 |
-19 |
-4 749 |
23 007 |
-17.1% |
-17.9% |
Middle Americas |
37 314 |
- |
617 |
37 931 |
1.7% |
0.9% |
South America |
40 644 |
- |
- 911 |
39 733 |
-2.2% |
-2.6% |
EMEA |
23 724 |
49 |
-367 |
23 407 |
-1.5% |
-1.6% |
Asia Pacific |
27 610 |
- |
62 |
27 672 |
0.2% |
0.1% |
Global Export and Holding Companies |
217 |
-30 |
-46 |
141 |
-24.4% |
23.2% |
AB InBev Worldwide |
157 284 |
- |
-5 393 |
151 891 |
-3.4% |
-4.0% |
9M22 |
Scope |
Organic |
9M23 |
Organic growth |
||
|
growth |
Total |
Own beer |
|||
North America |
79 223 |
31 |
-8 853 |
70 401 |
-11.2% |
-11.6% |
Middle Americas |
109 338 |
- |
757 |
110 095 |
0.7% |
-0.2% |
South America |
117 459 |
- |
-1 703 |
115 756 |
-1.4% |
-2.0% |
EMEA |
66 686 |
153 |
- 591 |
66 249 |
-0.9% |
-1.1% |
Asia Pacific |
72 995 |
- |
4 266 |
77 261 |
5.8% |
5.7% |
Global Export and Holding Companies |
657 |
-185 |
-214 |
259 |
-45.2% |
-48.5% |
AB InBev Worldwide |
446 358 |
- |
-6 336 |
440 021 |
-1.4% |
-1.9% |
Key Market Performances
United States: Revenue declined by 13.5% impacted by volume performance
-
Operating performance:
- 3Q23: Revenue declined by 13.5% with revenue per hl increasing by 4.9% driven by revenue management initiatives. Sales-to-wholesalers (STWs) declined by 17.6%. Sales-to-retailers (STRs) were down by 16.6%, primarily due to the volume decline of Bud Light and impacted by shipment phasing ahead of our October price increase last year. EBITDA declined by 29.3%, with approximately two thirds of this decrease attributable to market share performance and the remainder from productivity loss, increased sales and marketing investments and support measures for our wholesaler partners.
- 9M23: Revenue declined by 7.1% with revenue per hl growth of 5.3%. Our STWs declined by 11.7% and STRs were down by 11.8%. EBITDA decreased by 20.0%.
- Commercial highlights: The beer industry remained resilient in 3Q23, delivering revenue growth of 3.3% and gaining share of total alcohol by value in the off-premise, according to Circana. Our total beer market share has remained stable since the last week of April through the end of September. To support our long-term strategy, we continue to invest in our megabrands, wholesaler support measures and key partnerships including the NFL and Folds of Honor, as well as new activations in college football and the NBA. In Beyond Beer, our spirits based ready-to-drink portfolio continued to grow volume by strong double-digits, outperforming the industry.
Mexico: Mid-single digit top- and bottom-line growth
-
Operating performance:
- 3Q23: Revenue grew by mid-single digits with high-single digit revenue per hl growth driven by pricing actions and other revenue management initiatives. Volumes declined by low-single digits, slightly underperforming a soft industry as we cycled a strong market share performance in 3Q22. EBITDA grew by mid-single digits.
- 9M23: Revenue grew by more than 10% with revenue per hl growing by low-teens and volumes flattish. EBITDA grew by low-teens.
- Commercial highlights: Our core brands delivered mid-single digit revenue growth this quarter and our above core portfolio continued to outperform, led by the strong performance of Modelo and Pacifico. We continued to progress our digital initiatives with our Vendo platform in BEES now enabling digital utilities payments and mobile data purchases in more than 90 000 points of sale and generating over 170 000 transactions in 3Q23.
Colombia: Double-digit top- and bottom-line growth
-
Operating performance:
- 3Q23: Revenue grew by mid-teens with low-single digit volume and low-teens revenue per hl growth, driven by pricing actions and other revenue management initiatives. EBITDA grew by mid-teens.
- 9M23: Revenue grew by high-single digits with revenue per hl growth of high-single digits. Volumes were flattish. EBITDA grew by more than 10%.
- Commercial highlights: Our core portfolio led our performance this quarter, delivering mid-teens revenue growth with a particularly strong performance from Poker which grew volumes by high-single digits. In the above core segment, Corona outperformed the industry delivering low-teens volume growth.
Brazil: Mid-single digit top-line and double-digit bottom-line growth with 628bps of margin expansion
-
Operating performance:
- 3Q23: Revenue grew by 5.3% with revenue per hl growth of 5.5% driven by revenue management initiatives in an environment of moderating inflation. Total volumes were flat, with beer volumes declining by 1.1%, slightly underperforming the industry as we cycled all-time high quarterly volumes in 3Q22. Non-beer volumes increased by 3.7%. EBITDA increased by 30.5% with margin expansion of 628bps.
- 9M23: Total volumes were flat with beer volumes down 1.0% and non-beer volumes up 3.0%. Both revenue and revenue per hl increased by 9.9%. EBITDA grew by 28.7% with margin expansion of 435bps.
- Commercial highlights: Our premium and super premium brands continued to outperform this quarter, delivering volume growth in the low-teens, led by Original, Spaten and Corona. Non-beer performance was led by our low- and no-sugar portfolio, which grew volumes by over 20%. BEES Marketplace continued to expand, reaching over 750 000 customers, a 15% increase versus 3Q22, and growing GMV by 32%. Our digital DTC platform, Zé Delivery, reached 4.7 million monthly active users this quarter, a 9% increase versus 3Q22, and increased GMV by 8%.
Europe: Low-single digit top- and bottom-line growth
-
Operating performance:
- 3Q23: Revenue grew by low-single digits with mid-teens revenue per hl growth, driven by pricing actions and the continued momentum of our premium and super premium brands. Volumes declined by high-single digits, outperforming a soft industry in more than 80% of our key markets according to our estimates. EBITDA grew by low-single digits.
- 9M23: Revenue grew by high-single digits, driven by mid-teens revenue per hl growth. Volumes declined by mid-single digits. EBITDA increased by mid-single digits.
- Commercial highlights: We continue to drive premiumization across Europe. Our performance this quarter was driven by our premium and super premium brands which grew revenues by mid-single digits, led by Leffe and Stella Artois. Our digital transformation in Europe is progressing, with BEES now live in the UK, Germany, and the Canary Islands.
South Africa: Double digit top- and mid-single digit bottom-line growth
-
Operating performance:
- 3Q23: Top line grew by high-teens, with revenue per hl growth of high-single digits, driven by revenue management initiatives and continued premiumization. Our volumes increased by high-single digits, outperforming the industry according to our estimates, and supported by shipment phasing ahead of our October price increase. EBITDA grew by mid-single digits, as top-line growth was partially offset by anticipated transactional FX and commodity cost headwinds.
- 9M23: Revenue grew by mid-teens with high-single digit revenue per hl growth and a mid-single digit increase in volume. EBITDA grew by low-single digits.
- Commercial highlights: The momentum of our business continued this quarter, with our portfolio gaining share of both beer and total alcohol, according to our estimates. Our core portfolio continued to outperform, delivering high-single digit volume growth, and our global brands grew volumes by more than 35%, driven by Corona and Stella Artois.
China: High-single digit top- and bottom-line growth
-
Operating performance:
- 3Q23: Our top-line grew by 7.1% with revenue per hl increasing by 7.3%, driven by on-premise recovery and continued premiumization. Volumes were flattish, outperforming a softer industry. EBITDA increased by 9.6%.
- 9M23: Volumes grew by 5.7% and revenue per hl by 6.4%, leading to a total revenue increase of 12.5%. EBITDA grew by 14.8%.
- Commercial highlights: We continue to invest behind our commercial strategy, focused on premiumization, channel and geographic expansion, and digital transformation. Our performance this quarter was led by our premium and super premium brands which grew volumes by more than 10%, driven by on-premise recovery and expansion into new cities. The roll out and adoption of the BEES platform continued, with BEES now present in over 230 cities and with over 65% of our revenue generated through digital channels in September.
Highlights from our other markets
- Canada: Revenue declined by high-single digits this quarter with revenue per hl growth of high-single digits, driven by revenue management initiatives and premiumization. Volumes declined by low-teens, underperforming a soft industry.
- Peru: Revenue grew by over 10% this quarter with revenue per hl increasing by high-single digits, driven primarily by revenue management initiatives. Volumes increased by low-single digits, driven by the performance of our leading core brand Pilsen Callao and our non-beer portfolio.
- Ecuador: Revenue grew by mid-single digits this quarter despite volumes declining low-single digits as the industry was impacted by four fewer trading days due to election related dry laws. Our above core brands continued to lead our performance, delivering a high-single digit revenue increase.
- Argentina: Revenue increased by over 100% on an organic basis in 3Q23, driven by revenue management initiatives in a highly inflationary environment. Volumes declined by mid-teens as overall consumer demand was impacted by inflationary pressures.
- Africa excluding South Africa: In Nigeria, our top-line grew by over 30% this quarter driven by pricing actions and other revenue management initiatives. Beer volumes declined by more than 10%, driven by a soft industry which was impacted by the continued challenging operating environment. In our other markets, we grew volumes in aggregate by high-single digits in 3Q23, driven primarily by Mozambique, Tanzania, and Uganda.
- South Korea: Total revenue decreased by high-single digits this quarter with a mid-single digit volume decline, underperforming a soft industry which cycled post-COVID recovery in 3Q22. Revenue per hl decreased by low-single digits, driven primarily by an excise tax increase earlier in the year.
Consolidated Income Statement
Figure 3. Consolidated income statement (million USD) |
|||
3Q22 |
3Q23 |
Organic |
|
growth |
|||
Revenue |
15 091 |
15 574 |
5.0% |
Cost of sales |
-6 860 |
-7 180 |
-6.0% |
Gross profit |
8 232 |
8 394 |
4.1% |
SG&A |
-4 347 |
-4 583 |
-6.0% |
Other operating income/(expenses) |
170 |
217 |
18.8% |
Normalized profit from operations (normalized EBIT) |
4 055 |
4 027 |
2.7% |
Non-underlying items above EBIT (incl. impairment losses) |
-165 |
-352 |
|
Net finance income/(cost) |
-1 313 |
-1 223 |
|
Non-underlying net finance income/(cost) |
-144 |
84 |
|
Share of results of associates |
81 |
95 |
|
Income tax expense |
-688 |
-666 |
|
Profit |
1 825 |
1 966 |
|
Profit attributable to non-controlling interest |
392 |
494 |
|
Profit attributable to equity holders of AB InBev |
1 433 |
1 472 |
|
|
|||
Normalized EBITDA |
5 313 |
5 431 |
4.1% |
Underlying profit attributable to equity holders of AB InBev |
1 682 |
1 735 |
|
9M22 |
9M23 |
Organic |
|
growth |
|||
Revenue |
43 118 |
44 907 |
8.3% |
Cost of sales |
-19 644 |
-20 717 |
-9.6% |
Gross profit |
23 475 |
24 190 |
7.2% |
SG&A |
-12 963 |
-13 635 |
-8.5% |
Other operating income/(expenses) |
648 |
544 |
23.4% |
Normalized profit from operations (normalized EBIT) |
11 160 |
11 099 |
6.2% |
Non-underlying items above EBIT (incl. impairment losses) |
-270 |
-458 |
|
Net finance income/(cost) |
-3 757 |
-3 743 |
|
Non-underlying net finance income/(cost) |
32 |
-619 |
|
Share of results of associates |
210 |
201 |
|
Non-underlying share of results of associates |
-1 143 |
- |
|
Income tax expense |
-1 933 |
-1 858 |
|
Profit |
4 299 |
4 621 |
|
Profit attributable to non-controlling interest |
1 174 |
1 171 |
|
Profit attributable to equity holders of AB InBev |
3 126 |
3 450 |
|
|
|||
Normalized EBITDA |
14 896 |
15 099 |
7.3% |
Underlying profit attributable to equity holders of AB InBev |
4 354 |
4 497 |
|
We are reporting our Argentinean operation applying hyperinflation accounting under IAS 29, following the categorization of Argentina as a country with a three-year cumulative inflation rate greater than 100%, since 2018. Inflation in Argentina has accelerated, resulting in a more significant impact on the organic revenue growth of AB InBev than historically. For illustrative purposes, fully excluding the Argentinean operation, the 3Q23 organic revenue increase for AB InBev would be 1.6% versus the 5.0% reported. For 9M23 revenue growth for AB InBev would be 4.9% versus the 8.3% reported.
Consolidated other operating income/(expenses) in 3Q23 increased by 23.4% primarily driven by higher government grants. In 9M22, Ambev recognized 201 million USD income in other operating income related to tax credits. The year-over-year change is presented as a scope change and does not affect the presented organic growth rates.
Non-underlying items above EBIT & Non-underlying share of results of associates
Figure 4. Non-underlying items above EBIT & Non-underlying share of results of associates (million USD) |
||||
3Q22 |
3Q23 |
9M22 |
9M23 |
|
COVID-19 costs |
-2 |
- |
-16 |
- |
Restructuring |
-13 |
-28 |
-63 |
-78 |
Business and asset disposal (incl. impairment losses) |
-149 |
-324 |
-143 |
-361 |
Legal costs |
- |
- |
- |
-19 |
AB InBev Efes related costs |
-1 |
- |
-48 |
- |
Non-underlying items in EBIT |
-165 |
-352 |
-270 |
-458 |
Non-underlying share of results of associates |
- |
- |
-1 143 |
- |
EBIT excludes negative non-underlying items of 352 million USD in 3Q23 and 458 million USD in 9M23. In 3Q23, we recognized a loss of approximately 300 million USD upon disposal of a portfolio of eight beer and beverage brands and associated assets in the US to Tilray Brands, Inc.
Non-underlying share of results of associates of 9M22 includes the non-cash impairment of 1 143 million USD the company recorded on its investment in AB InBev Efes in 1Q22.
Net finance income/(cost)
Figure 5. Net finance income/(cost) (million USD) |
||||
3Q22 |
3Q23 |
9M22 |
9M23 |
|
Net interest expense |
-826 |
-789 |
-2 509 |
-2 419 |
Net interest on net defined benefit liabilities |
-18 |
-22 |
-55 |
-64 |
Accretion expense |
-215 |
-194 |
-551 |
-579 |
Net interest income on Brazilian tax credits |
34 |
29 |
146 |
107 |
Other financial results |
-287 |
-247 |
-788 |
-787 |
Net finance income/(cost) |
-1 313 |
-1 223 |
-3 757 |
-3 743 |
Non-underlying net finance income/(cost)
Figure 6. Non-underlying net finance income/(cost) (million USD) |
||||
3Q22 |
3Q23 |
9M22 |
9M23 |
|
Mark-to-market |
-144 |
84 |
152 |
-619 |
Gain/(loss) on bond redemption and other |
- |
- |
-120 |
- |
Non-underlying net finance income/(cost) |
-144 |
84 |
32 |
-619 |
Non-underlying net finance cost in 9M23 includes mark-to-market losses on derivative instruments entered into to hedge our shared-based payment programs and shares issued in relation to the combination with Grupo Modelo and SAB.
The number of shares covered by the hedging of our share-based payment program, the deferred share instrument and the restricted shares are shown in figure 7, together with the opening and closing share prices.
Figure 7. Non-underlying equity derivative instruments |
||||
3Q22 |
3Q23 |
9M22 |
9M23 |
|
Share price at the start of the period (Euro) |
51.36 |
51.83 |
53.17 |
56.27 |
Share price at the end of the period (Euro) |
46.75 |
52.51 |
46.75 |
52.51 |
Number of equity derivative instruments at the end of the period (millions) |
100.5 |
100.5 |
100.5 |
100.5 |
Income tax expense
Figure 8. Income tax expense (million USD) |
||||
3Q22 |
3Q23 |
9M22 |
9M23 |
|
Income tax expense |
688 |
666 |
1 933 |
1 858 |
Effective tax rate |
28.3% |
26.3% |
27.0% |
29.6% |
Normalized effective tax rate |
26.3% |
25.2% |
27.5% |
26.5% |
The decrease in normalized ETR in 3Q23 compared to 3Q22 and the decrease in 9M23 compared to 9M22 is driven by country mix.
Figure 9. Underlying Profit attributable to equity holders of AB InBev (million USD) |
||||
3Q22 |
3Q23 |
9M22 |
9M23 |
|
Profit attributable to equity holders of AB InBev |
1 433 |
1 472 |
3 126 |
3 450 |
Net impact of non-underlying items on profit |
274 |
224 |
1 280 |
973 |
Hyperinflation impacts in underlying profit |
- 26 |
39 |
- 52 |
74 |
Underlying profit attributable to equity holders of AB InBev |
1 682 |
1 735 |
4 354 |
4 497 |
Underlying profit attributable to equity holders in 3Q22 and 9M22 were positively impacted by 21 million USD and 172 million USD respectively, and in 3Q23 and 9M23 by 18 million USD and 66 million USD respectively, after tax and non-controlling interest related to tax credits in Brazil.
Basic and underlying EPS
Figure 10. Earnings per share (USD) |
||||
3Q22 |
3Q23 |
9M22 |
9M23 |
|
Basic EPS |
0.71 |
0.73 |
1.55 |
1.71 |
Net impact of non-underlying items on profit |
0.13 |
0.11 |
0.63 |
0.48 |
Hyperinflation impacts in EPS |
-0.01 |
0.02 |
-0.03 |
0.04 |
Underlying EPS |
0.84 |
0.86 |
2.16 |
2.23 |
Weighted average number of ordinary and restricted shares (million) |
2 012 |
2 016 |
2 012 |
2 016 |
Figure 11. Key components - Underlying EPS in USD |
||||
3Q22 |
3Q23 |
9M22 |
9M23 |
|
Normalized EBIT before hyperinflation |
2.02 |
2.02 |
5.58 |
5.56 |
Hyperinflation impacts in normalized EBIT |
-0.01 |
-0.03 |
-0.03 |
-0.06 |
Normalized EBIT |
2.02 |
2.00 |
5.55 |
5.51 |
Net finance cost |
-0.65 |
-0.61 |
-1.87 |
-1.86 |
Income tax expense |
-0.36 |
-0.35 |
-1.01 |
-0.97 |
Associates & non-controlling interest |
-0.15 |
-0.20 |
-0.48 |
-0.49 |
Hyperinflation impacts in EPS |
-0.01 |
0.02 |
-0.03 |
0.04 |
Underlying EPS |
0.84 |
0.86 |
2.16 |
2.23 |
Weighted average number of ordinary and restricted shares (million) |
2 012 |
2 016 |
2 012 |
2 016 |
Reconciliation between normalized EBITDA and profit attributable to equity holders
Figure 12. Reconciliation of normalized EBITDA to profit attributable to equity holders of AB InBev (million USD) |
||||
3Q22 |
3Q23 |
9M22 |
9M23 |
|
Profit attributable to equity holders of AB InBev |
1 433 |
1 472 |
3 126 |
3 450 |
Non-controlling interests |
392 |
494 |
1 174 |
1 171 |
Profit |
1 825 |
1 966 |
4 299 |
4 621 |
Income tax expense |
688 |
666 |
1 933 |
1 858 |
Share of result of associates |
-81 |
-95 |
-210 |
-201 |
Non-underlying share of results of associates |
- |
- |
1 143 |
- |
Net finance (income)/cost |
1 313 |
1 223 |
3 757 |
3 743 |
Non-underlying net finance (income)/cost |
144 |
-84 |
-32 |
619 |
Non-underlying items above EBIT (incl. impairment losses) |
165 |
352 |
270 |
458 |
Normalized EBIT |
4 055 |
4 027 |
11 160 |
11 099 |
Depreciation, amortization and impairment |
1 259 |
1 403 |
3 736 |
3 999 |
Normalized EBITDA |
5 313 |
5 431 |
14 896 |
15 099 |
Normalized EBITDA and normalized EBIT are measures utilized by AB InBev to demonstrate the company’s underlying performance.
Normalized EBITDA is calculated excluding the following effects from profit attributable to equity holders of AB InBev: (i) non-controlling interest; (ii) income tax expense; (iii) share of results of associates; (iv) non-underlying share of results of associates; (v) net finance income or cost; (vi) non-underlying net finance income or cost; (vii) non-underlying items above EBIT; and (viii) depreciation, amortization and impairment.
Normalized EBITDA and normalized EBIT are not accounting measures under IFRS accounting and should not be considered as an alternative to profit attributable to equity holders as a measure of operational performance, or an alternative to cash flow as a measure of liquidity. Normalized EBITDA and normalized EBIT do not have a standard calculation method and AB InBev’s definition of normalized EBITDA and normalized EBIT may not be comparable to that of other companies.
Recent Events
Announcement of 3 Billion USD cash tender offer
On 31st October 2023, the company approved the launch of a cash tender offer for up to 3 billion USD in aggregate purchase price of outstanding bonds. Additional details will be provided in the press release section of our website at https://www.ab-inbev.com/news-media/press-releases/.
Announcement of 1 Billion USD share buyback program to be executed within the next 12 months
On 30th October 2023, the AB InBev Board of Directors approved a 1 billion USD share buyback program to be executed within the next 12 months. The share buyback program will be implemented in accordance with industry best practices and in compliance with the applicable buyback rules and regulations. To this end, an independent financial intermediary will be appointed to repurchase on the basis of a discretionary mandate. The precise timing of the repurchase of shares pursuant to the program will depend on a variety of factors including market conditions. During the share buyback program, the company will regularly publish press releases with updates on the progress made (if any) as required by law. This information will also be available on the investor relations pages of our website under the payouts section (https://www.ab-inbev.com/investors/payouts/). Our current intention is to hold the shares acquired as treasury shares to fulfil future share delivery commitments under the stock ownership plans. The program will be executed under the powers granted at the General Meeting of Shareholders on 28 April 2021.
Notes
To facilitate the understanding of AB InBev’s underlying performance, the analyses of growth, including all comments in this press release, unless otherwise indicated, are based on organic growth and normalized numbers. In other words, financials are analyzed eliminating the impact of changes in currencies on translation of foreign operations, and scope changes. Scope changes represent the impact of acquisitions and divestitures, the start or termination of activities or the transfer of activities between segments, curtailment gains and losses and year over year changes in accounting estimates and other assumptions that management does not consider as part of the underlying performance of the business. The organic growth of our global brands, Budweiser, Stella Artois, Corona and Michelob Ultra, excludes exports to Australia for which a perpetual license was granted to a third party upon disposal of the Australia operations in 2020. All references per hectoliter (per hl) exclude US non-beer activities. Whenever presented in this document, all performance measures (EBITDA, EBIT, profit, tax rate, EPS) are presented on a “normalized” basis, which means they are presented before non-underlying items. Non-underlying items are either income or expenses which do not occur regularly as part of the normal activities of the Company. They are presented separately because they are important for the understanding of the underlying sustainable performance of the Company due to their size or nature. Normalized measures are additional measures used by management and should not replace the measures determined in accordance with IFRS as an indicator of the Company’s performance. As from 1 January 2023, mark-to-market gains/(losses) on derivatives related to the hedging of our share-based payment programs are reported in the non-underlying net finance income/(cost). The 2022 presentation was amended to conform to the 2023 presentation. We are reporting the results from Argentina applying hyperinflation accounting since 3Q18. The IFRS rules (IAS 29) require us to restate the year-to-date results for the change in the general purchasing power of the local currency, using official indices before converting the local amounts at the closing rate of the period. These impacts are excluded from organic calculations. In 9M23, we reported a negative impact on the profit attributable to equity holders of AB InBev of 74 million USD. The impact in 9M23 underlying EPS was -0.04 USD. Values in the figures and annexes may not add up, due to rounding. 3Q23 and 9M23 EPS is based upon a weighted average of 2 016 million shares compared to a weighted average of 2 012 million shares for 3Q22 and 9M22.
Legal disclaimer
This release contains “forward-looking statements”. These statements are based on the current expectations and views of future events and developments of the management of AB InBev and are naturally subject to uncertainty and changes in circumstances. The forward-looking statements contained in this release include statements other than historical facts and include statements typically containing words such as “will”, “may”, “should”, “believe”, “intends”, “expects”, “anticipates”, “targets”, “estimates”, “likely”, “foresees” and words of similar import. All statements other than statements of historical facts are forward-looking statements. You should not place undue reliance on these forward-looking statements, which reflect the current views of the management of AB InBev, are subject to numerous risks and uncertainties about AB InBev and are dependent on many factors, some of which are outside of AB InBev’s control. There are important factors, risks and uncertainties that could cause actual outcomes and results to be materially different, including, but not limited to the risks and uncertainties relating to AB InBev that are described under Item 3.D of AB InBev’s Annual Report on Form 20-F filed with the SEC on 17 March 2023. Many of these risks and uncertainties are, and will be, exacerbated by any further worsening of the global business and economic environment, the ongoing conflict in Russia and Ukraine and the Middle East and the COVID-19 pandemic. Other unknown or unpredictable factors could cause actual results to differ materially from those in the forward-looking statements. The forward-looking statements should be read in conjunction with the other cautionary statements that are included elsewhere, including AB InBev’s most recent Form 20-F and other reports furnished on Form 6-K, and any other documents that AB InBev has made public. Any forward-looking statements made in this communication are qualified in their entirety by these cautionary statements and there can be no assurance that the actual results or developments anticipated by AB InBev will be realized or, even if substantially realized, that they will have the expected consequences to, or effects on, AB InBev or its business or operations. Except as required by law, AB InBev undertakes no obligation to publicly update or revise any forward-looking statements, whether as a result of new information, future events or otherwise. The third quarter 2023 (3Q23) and the nine months 2023 (9M23) financial data set out in Figure 1 (except for the volume information), Figures 3 to 5, 6, 8, 9 and 12 of this press release have been extracted from the group’s unaudited condensed consolidated interim financial statements as of and for the nine months ended 30 September 2023, which have been reviewed by our statutory auditors PwC Réviseurs d’Entreprises SRL / PwC Bedrijfsrevisoren BV in accordance with the standards of the Public Company Accounting Oversight Board (United States). Financial data included in Figures 7, 10 and 11 have been extracted from the underlying accounting records as of and for the nine months ended 30 September 2023 (except for the volume information). References in this document to materials on our websites, such as www.abinbev.com or www.bees.com, are included as an aid to their location and are not incorporated by reference into this document.
Conference call and webcast
Investor Conference call and webcast on Tuesday, 31 October 2023:
2.00pm Brussels / 1.00pm London / 9.00am New York
Registration details:
Webcast (listen-only mode):
AB InBev 3Q23 Results Webcast
To join by phone, please use one of the following two phone numbers:
Toll-Free: 877-407-8029
Toll: 201-689-8029
About Anheuser-Busch InBev (AB InBev)
Anheuser-Busch InBev (AB InBev) is a publicly traded company (Euronext: ABI) based in Leuven, Belgium, with secondary listings on the Mexico (MEXBOL: ANB) and South Africa (JSE: ANH) stock exchanges and with American Depositary Receipts on the New York Stock Exchange (NYSE: BUD). As a company, we dream big to create a future with more cheers. We are always looking to serve up new ways to meet life’s moments, move our industry forward and make a meaningful impact in the world. We are committed to building great brands that stand the test of time and to brewing the best beers using the finest ingredients. Our diverse portfolio of well over 500 beer brands includes global brands Budweiser®, Corona®, Stella Artois® and Michelob Ultra®; multi-country brands Beck’s®, Hoegaarden® and Leffe®; and local champions such as Aguila®, Antarctica®, Bud Light®, Brahma®, Cass®, Castle®, Castle Lite®, Cristal®, Harbin®, Jupiler®, Modelo Especial®, Quilmes®, Victoria®, Sedrin®, and Skol®. Our brewing heritage dates back more than 600 years, spanning continents and generations. From our European roots at the Den Hoorn brewery in Leuven, Belgium. To the pioneering spirit of the Anheuser & Co brewery in St. Louis, US. To the creation of the Castle Brewery in South Africa during the Johannesburg gold rush. To Bohemia, the first brewery in Brazil. Geographically diversified with a balanced exposure to developed and developing markets, we leverage the collective strengths of approximately 167,000 colleagues based in nearly 50 countries worldwide. For 2022, AB InBev’s reported revenue was 57.8 billion USD (excluding JVs and associates).
Annex 1: Segment reporting (3Q)
AB InBev Worldwide |
3Q22 |
Scope |
Currency Translation |
Hyperinflation restatement |
Organic Growth |
3Q23 |
Organic Growth |
Total volumes (thousand hls) |
157 284 |
- |
- |
- |
-5 393 |
151 891 |
-3.4% |
of which AB InBev own beer |
137 796 |
17 |
- |
- |
-5 488 |
132 325 |
-4.0% |
Revenue |
15 091 |
-16 |
-494 |
248 |
745 |
15 574 |
5.0% |
Cost of sales |
-6 860 |
1 |
257 |
-171 |
- 408 |
-7 180 |
-6.0% |
Gross profit |
8 232 |
-15 |
-237 |
77 |
337 |
8 394 |
4.1% |
SG&A |
-4 347 |
-10 |
116 |
-82 |
-259 |
-4 583 |
-6.0% |
Other operating income/(expenses) |
170 |
9 |
3 |
2 |
32 |
217 |
18.8% |
Normalized EBIT |
4 055 |
-16 |
-119 |
-3 |
110 |
4 027 |
2.7% |
Normalized EBITDA |
5 313 |
-6 |
-145 |
53 |
216 |
5 431 |
4.1% |
Normalized EBITDA margin |
35.2% |
34.9% |
-29 bps |
||||
|
|||||||
North America |
3Q22 |
Scope |
Currency Translation |
Hyperinflation restatement |
Organic Growth |
3Q23 |
Organic Growth |
Total volumes (thousand hls) |
27 775 |
-19 |
- |
- |
-4 749 |
23 007 |
-17.1% |
Revenue |
4 442 |
-1 |
-15 |
- |
-564 |
3 863 |
-12.7% |
Cost of sales |
-1 800 |
- |
5 |
- |
140 |
-1 656 |
7.8% |
Gross profit |
2 642 |
-1 |
-10 |
- |
-424 |
2 207 |
-16.1% |
SG&A |
-1 142 |
-2 |
5 |
- |
-29 |
-1 168 |
-2.5% |
Other operating income/(expenses) |
6 |
- |
3 |
- |
-10 |
-2 |
- |
Normalized EBIT |
1 506 |
-3 |
-2 |
- |
-463 |
1 038 |
-30.8% |
Normalized EBITDA |
1 686 |
-3 |
-3 |
- |
-449 |
1 231 |
-26.7% |
Normalized EBITDA margin |
37.9% |
31.9% |
-608 bps |
||||
|
|||||||
Middle Americas |
3Q22 |
Scope |
Currency Translation |
Hyperinflation restatement |
Organic Growth |
3Q23 |
Organic Growth |
Total volumes (thousand hls) |
37 314 |
- |
- |
- |
617 |
37 931 |
1.7% |
Revenue |
3 574 |
- |
368 |
- |
396 |
4 338 |
11.1% |
Cost of sales |
-1 395 |
-7 |
-134 |
- |
-186 |
-1 722 |
-13.3% |
Gross profit |
2 180 |
-7 |
234 |
- |
210 |
2 617 |
9.6% |
SG&A |
-880 |
-6 |
-98 |
- |
-11 |
-995 |
-1.2% |
Other operating income/(expenses) |
3 |
8 |
2 |
- |
3 |
16 |
- |
Normalized EBIT |
1 303 |
-5 |
137 |
- |
203 |
1 637 |
15.6% |
Normalized EBITDA |
1 631 |
3 |
181 |
- |
236 |
2 051 |
14.5% |
Normalized EBITDA margin |
45.6% |
47.3% |
141 bps |
||||
|
|||||||
South America |
3Q22 |
Scope |
Currency Translation |
Hyperinflation restatement |
Organic Growth |
3Q23 |
Organic Growth |
Total volumes (thousand hls) |
40 644 |
- |
- |
- |
- 911 |
39 733 |
-2.2% |
Revenue |
2 887 |
1 |
-688 |
248 |
658 |
3 106 |
23.4% |
Cost of sales |
-1 522 |
- |
297 |
-171 |
-188 |
-1 586 |
-12.8% |
Gross profit |
1 364 |
1 |
-391 |
77 |
470 |
1 521 |
35.0% |
SG&A |
-854 |
-3 |
185 |
-82 |
-128 |
-882 |
-15.4% |
Other operating income/(expenses) |
64 |
5 |
1 |
2 |
32 |
105 |
47.5% |
Normalized EBIT |
574 |
2 |
-204 |
-3 |
375 |
744 |
64.7% |
Normalized EBITDA |
795 |
2 |
-258 |
53 |
421 |
1 013 |
54.5% |
Normalized EBITDA margin |
27.5% |
32.6% |
674 bps |
EMEA |
3Q22 |
Scope |
Currency Translation |
Hyperinflation restatement |
Organic Growth |
3Q23 |
Organic Growth |
Total volumes (thousand hls) |
23 724 |
49 |
- |
- |
-367 |
23 407 |
-1.5% |
Revenue |
2 110 |
17 |
-73 |
- |
212 |
2 266 |
9.9% |
Cost of sales |
-1 065 |
-10 |
49 |
- |
-155 |
-1 181 |
-14.4% |
Gross profit |
1 045 |
7 |
-24 |
- |
57 |
1 085 |
5.4% |
SG&A |
-627 |
-12 |
8 |
- |
-21 |
-652 |
-3.2% |
Other operating income/(expenses) |
50 |
-3 |
-1 |
- |
17 |
62 |
35.7% |
Normalized EBIT |
468 |
-8 |
-17 |
- |
53 |
496 |
11.5% |
Normalized EBITDA |
744 |
-8 |
-28 |
- |
45 |
752 |
6.1% |
Normalized EBITDA margin |
35.3% |
33.2% |
-121 bps |
||||
|
|||||||
Asia Pacific |
3Q22 |
Scope |
Currency Translation |
Hyperinflation restatement |
Organic Growth |
3Q23 |
Organic Growth |
Total volumes (thousand hls) |
27 610 |
- |
- |
- |
62 |
27 672 |
0.2% |
Revenue |
1 876 |
-4 |
-90 |
- |
96 |
1 878 |
5.1% |
Cost of sales |
-889 |
- |
43 |
- |
-39 |
-886 |
-4.4% |
Gross profit |
987 |
-4 |
-47 |
56 |
993 |
5.7% |
|
SG&A |
-549 |
2 |
25 |
- |
-46 |
-567 |
-8.4% |
Other operating income/(expenses) |
36 |
- |
-2 |
- |
1 |
34 |
2.8% |
Normalized EBIT |
474 |
-1 |
-24 |
- |
12 |
460 |
2.5% |
Normalized EBITDA |
638 |
-1 |
-33 |
- |
21 |
625 |
3.3% |
Normalized EBITDA margin |
34.0% |
33.3% |
-59 bps |
||||
|
|||||||
Global Export and Holding Companies |
3Q22 |
Scope |
Currency Translation |
Hyperinflation restatement |
Organic Growth |
3Q23 |
Organic Growth |
Total volumes (thousand hls) |
217 |
-30 |
- |
- |
-46 |
141 |
-24.4% |
Revenue |
202 |
-30 |
3 |
- |
-53 |
122 |
-30.6% |
Cost of sales |
-189 |
19 |
-2 |
- |
21 |
-151 |
12.3% |
Gross profit |
14 |
-11 |
1 |
- |
-32 |
-28 |
- |
SG&A |
-296 |
11 |
-9 |
- |
-26 |
-320 |
-9.2% |
Other operating income/(expenses) |
12 |
- |
- |
- |
-10 |
1 |
- |
Normalized EBIT |
-270 |
- |
-9 |
- |
-68 |
-347 |
-25.4% |
Normalized EBITDA |
-181 |
2 |
-4 |
- |
-58 |
-240 |
-32.2% |
Annex 2: Segment reporting (9M23)
AB InBev Worldwide |
9M22 |
Scope |
Currency Translation |
Organic Growth |
9M23 |
Organic Growth |
Total volumes (thousand hls) |
446 358 |
- |
- |
-6 336 |
440 021 |
-1.4% |
of which AB InBev own beer |
389 488 |
46 |
- |
-7 399 |
382 135 |
-1.9% |
Revenue |
43 118 |
-56 |
-1 704 |
3 549 |
44 907 |
8.3% |
Cost of sales |
-19 644 |
22 |
776 |
-1 871 |
-20 717 |
-9.6% |
Gross profit |
23 475 |
-34 |
-929 |
1 678 |
24 190 |
7.2% |
SG&A |
-12 963 |
-27 |
460 |
-1 104 |
-13 635 |
-8.5% |
Other operating income/(expenses) |
648 |
-194 |
-14 |
104 |
544 |
23.4% |
Normalized EBIT |
11 160 |
-255 |
-483 |
677 |
11 099 |
6.2% |
Normalized EBITDA |
14 896 |
-245 |
-616 |
1 064 |
15 099 |
7.3% |
Normalized EBITDA margin |
34.5% |
33.6% |
-31 bps |
|||
|
||||||
North America |
9M22 |
Scope |
Currency Translation |
Organic Growth |
9M23 |
Organic Growth |
Total volumes (thousand hls) |
79 223 |
31 |
- |
-8 853 |
70 401 |
-11.2% |
Revenue |
12 634 |
1 |
-82 |
-765 |
11 789 |
-6.1% |
Cost of sales |
-5 149 |
-3 |
28 |
48 |
-5 076 |
0.9% |
Gross profit |
7 486 |
-2 |
-54 |
-717 |
6 713 |
-9.6% |
SG&A |
-3 421 |
-30 |
30 |
-100 |
-3 521 |
-2.9% |
Other operating income/(expenses) |
34 |
- |
3 |
-20 |
16 |
- |
Normalized EBIT |
4 098 |
-32 |
-21 |
-837 |
3 209 |
-20.6% |
Normalized EBITDA |
4 660 |
-32 |
-25 |
-834 |
3 769 |
-18.0% |
Normalized EBITDA margin |
36.9% |
32.0% |
-466 bps |
|||
Middle Americas |
9M22 |
Scope |
Currency Translation |
Organic Growth |
9M23 |
Organic Growth |
Total volumes (thousand hls) |
109 338 |
- |
- |
757 |
110 095 |
0.7% |
Revenue |
10 267 |
- |
540 |
1 103 |
11 911 |
10.7% |
Cost of sales |
-4 020 |
-6 |
-192 |
-430 |
-4 648 |
-10.7% |
Gross profit |
6 248 |
-6 |
348 |
673 |
7 263 |
10.8% |
SG&A |
-2 511 |
-18 |
-151 |
-177 |
-2 858 |
-7.0% |
Other operating income/(expenses) |
-9 |
9 |
2 |
22 |
24 |
- |
Normalized EBIT |
3 728 |
-15 |
199 |
518 |
4 429 |
13.9% |
Normalized EBITDA |
4 691 |
-7 |
270 |
591 |
5 545 |
12.6% |
Normalized EBITDA margin |
45.7% |
46.6% |
78 bps |
|||
|
||||||
South America |
9M22 |
Scope |
Currency Translation |
Organic Growth |
9M23 |
Organic Growth |
Total volumes (thousand hls) |
117 459 |
- |
- |
-1 703 |
115 756 |
-1.4% |
Revenue |
8 220 |
1 |
-1 403 |
2 138 |
8 956 |
26.4% |
Cost of sales |
-4 315 |
- |
531 |
-750 |
-4 535 |
-17.6% |
Gross profit |
3 905 |
1 |
-872 |
1 388 |
4 421 |
36.0% |
SG&A |
-2 463 |
-16 |
383 |
-590 |
-2 686 |
-24.1% |
Other operating income/(expenses) |
376 |
-196 |
-10 |
105 |
276 |
58.9% |
Normalized EBIT |
1 818 |
-211 |
-499 |
904 |
2 011 |
56.7% |
Normalized EBITDA |
2 461 |
-211 |
-614 |
1 143 |
2 779 |
51.7% |
Normalized EBITDA margin |
29.9% |
31.0% |
539 bps |
EMEA |
9M22 |
Scope |
Currency Translation |
Organic Growth |
9M23 |
Organic Growth |
Total volumes (thousand hls) |
66 686 |
153 |
- |
- 591 |
66 249 |
-0.9% |
Revenue |
6 050 |
55 |
-409 |
641 |
6 337 |
10.5% |
Cost of sales |
-3 066 |
-30 |
240 |
-536 |
-3 392 |
-17.3% |
Gross profit |
2 984 |
25 |
-169 |
105 |
2 945 |
3.5% |
SG&A |
-1 968 |
-43 |
102 |
-50 |
-1 959 |
-2.5% |
Other operating income/(expenses) |
138 |
-7 |
-4 |
18 |
145 |
14.0% |
Normalized EBIT |
1 154 |
-24 |
-71 |
73 |
1 131 |
6.5% |
Normalized EBITDA |
1 936 |
-24 |
-126 |
107 |
1 894 |
5.6% |
Normalized EBITDA margin |
32.0% |
29.9% |
-138 bps |
|||
|
||||||
Asia Pacific |
9M22 |
Scope |
Currency Translation |
Organic Growth |
9M23 |
Organic Growth |
Total volumes (thousand hls) |
72 995 |
- |
- |
4 266 |
77 261 |
5.8% |
Revenue |
5 347 |
-10 |
-351 |
571 |
5 557 |
10.7% |
Cost of sales |
-2 544 |
- |
167 |
-258 |
-2 635 |
-10.1% |
Gross profit |
2 803 |
-10 |
-184 |
313 |
2 921 |
11.2% |
SG&A |
-1 548 |
6 |
98 |
-156 |
-1 600 |
-10.1% |
Other operating income/(expenses) |
103 |
- |
-6 |
-9 |
87 |
-9.2% |
Normalized EBIT |
1 358 |
-5 |
-92 |
148 |
1 408 |
10.9% |
Normalized EBITDA |
1 870 |
-5 |
-124 |
157 |
1 897 |
8.4% |
Normalized EBITDA margin |
35.0% |
34.1% |
-73 bps |
|||
|
||||||
Global Export and Holding Companies |
9M22 |
Scope |
Currency Translation |
Organic Growth |
9M23 |
Organic Growth |
Total volumes (thousand hls) |
657 |
-185 |
- |
-214 |
259 |
-45.2% |
Revenue |
601 |
-104 |
- |
-139 |
358 |
-28.0% |
Cost of sales |
-551 |
61 |
2 |
56 |
-431 |
11.4% |
Gross profit |
50 |
-42 |
2 |
-84 |
-73 |
- |
SG&A |
-1 052 |
75 |
-2 |
-32 |
-1 012 |
-3.3% |
Other operating income/(expenses) |
7 |
- |
1 |
-12 |
-4 |
- |
Normalized EBIT |
-995 |
33 |
1 |
-128 |
-1 089 |
-13.3% |
Normalized EBITDA |
-722 |
34 |
3 |
-101 |
-786 |
-14.7% |
View source version on businesswire.com: https://www.businesswire.com/news/home/20231030866670/en/
Contacts
Investors
Shaun Fullalove
Tel: +1 212 573 9287
E-mail: shaun.fullalove@ab-inbev.com
Maria Glukhova
Tel: +32 16 276 888
E-mail: maria.glukhova@ab-inbev.com
Cyrus Nentin
Tel: +1 646 746 9673
E-mail: cyrus.nentin@ab-inbev.com
Media
Fallon Buckelew
Tel: +1 310 592 6319
E-mail: fallon.buckelew@ab-inbev.com
Michaël Cloots
Tel: +32 497 167 183
E-mail: michael.cloots@ab-inbev.com


