
Premium athleisure brand Lululemon Athletica Inc. (NASDAQ: LULU) entered the holiday shopping season with solid momentum, sending shares through its all-time highs and peaking at $516.39 on Dec. 28, 2023. on Jan. 8, 2024, the company raised its Q4 2023 guidance driven by stronger-than-expected holiday sales. Instead of rallying higher, shares tumbled to a low of $478.13.
Shares continued to sell off into bounce attempts the following day. Ironically, footwear and NYSE: NKE">sports apparel competitors NIKE Inc. (NASDAQ: NKE) and Under Armour Inc. (NYSE: UAA) shares rallied on Lululemon’s raised guidance. Investors wonder if this “sell the news” reaction could be the template for retailers in the consumer discretionary sector reporting their fourth-quarter earnings.
Margin recovery and expansion
Like most retail apparel makers, Lululemon also took a hit on margins in 2023 as revenues grew due to promotional activity. It started 2023 with Q4 2023 margins falling (-90 bps) to (-110 bps versus earlier expectation of rising 10 bps to 20 bps. Lululemon was able to reverse the course of margin shrinkage back to expansion by Q3 2024, when they grew 110 bps to 57%.
Lululemon expected margins to continue expanding from 58.6% to 58.7% in Q4 2024, up from earlier guidance of 58.3% to 58.6%. During its Q3 2023 release, Lululemon had actually lowered its Q4 guidance to $4.85 to $4.93 versus $4.94 consensus analyst estimates. This caused shares to tumble 4% to a low of $448.81 on Dec. 8, 2023, before staging a rally towards all-time highs. Check out the sector heatmap on MarketBeat.
Sour reaction to raised expectations
On Jan. 8, 2024, Lululemon raised its Q4 2023 EPS guidance to $4.95 to $5.00 versus $4.97 consensus analyst estimates. Its Q4 2023 revenues are expected to grow 14% to 15% between $3.17 billion and $3.19 billion, up from $3.135 billion to $3.17 billion versus $3.18 billion consensus estimates. Gross margins were raised to $58.6 to 58.7%, up from 58.3% to 58.6%.
Get AI-powered insights on MarketBeat.
The guidance shuffle dance
Revenue guidance is back in line with original forecasts before cutting them in Q3 2023. EPS guidance is slightly above original forecasts. The company had noted that the sales trend remained balanced, but the women’s business was standout, which was also the case in Q3 2023 when its women’s business revenues jumped 19% YoY. The company continued to command full pricing despite lots of promotions from competitors. The guidance shuffle may have put a bad taste in investors' mouths, believing the company had lowballed Q4 2023 estimates just to hop right over them again.
Nonetheless, the reaction was clearly a sell on the news, which is indicative of profit-taking. This could set up a template for reactions to the retailers in the upcoming earnings season where good news results in profit taking. Lululemon will report its Q4 2023 earnings report in March 2024.
Lululemon Athletic analyst ratings and price targets are at MarketBeat. Lululemon peers and competitor stocks can be found with the MarketBeat stock screener.
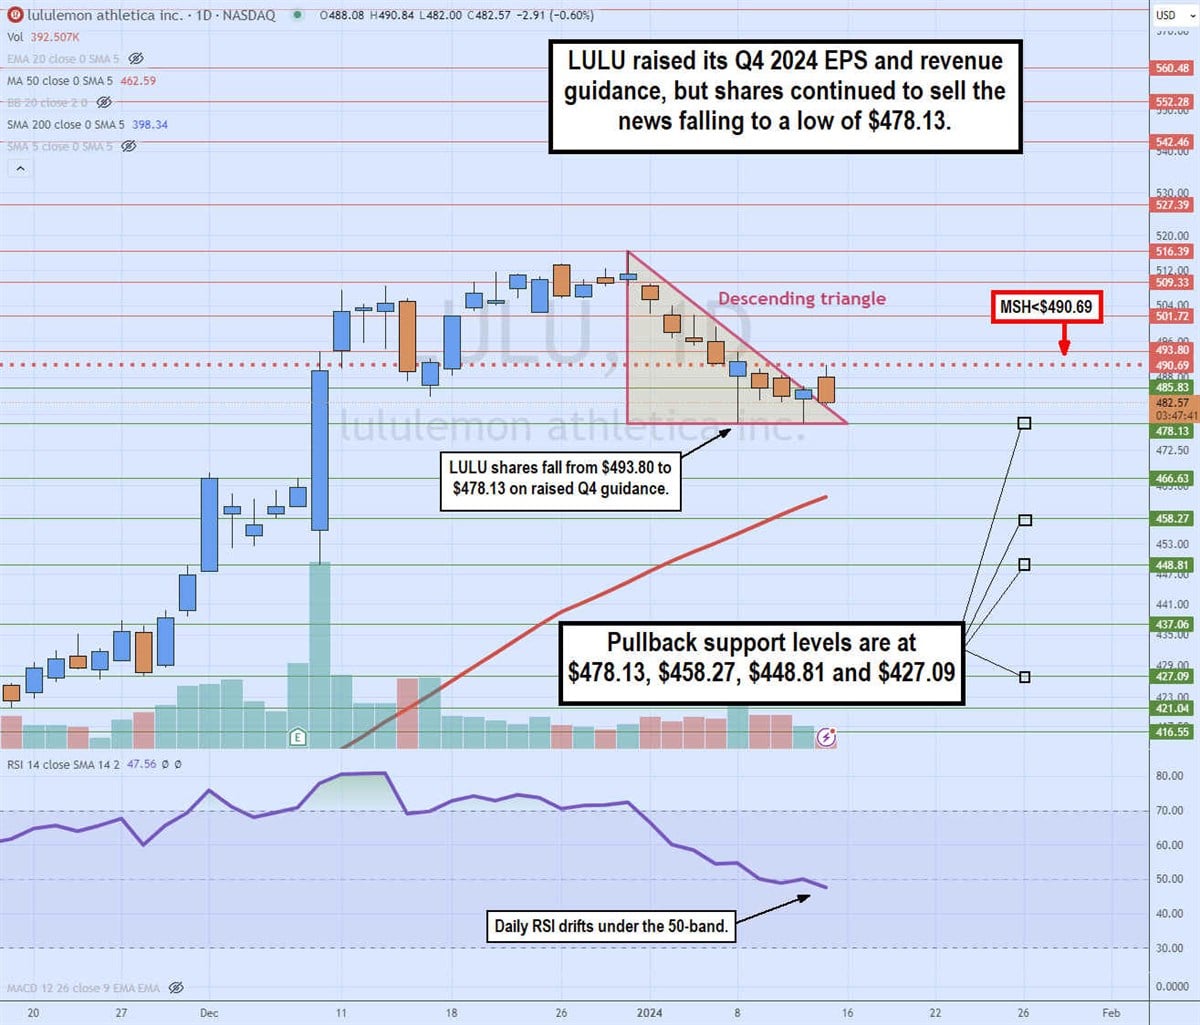
Daily descending triangle
The daily candlestick chart on LULU illustrates a descending triangle pattern. The descending trendline commenced after peaking at $516.39 on Dec. 29, 2023. LULU shares steadily sold off, making higher highs and lower lows. Connecting the lower lows formed the descending trendline. When LULU raised its Q4 2023 guidance, shares fell to a low of $478.13 and coiled to close at $491.48, forming a hammer candlestick bottom attempt on Jan. 8, 2024.
However, the daily market structure low (MSL) couldn't form a trigger since the next candlestick was a lower body low. An MSL trigger candle must have a low, lower low, and higher low.
The weekly market structure high (MSH) sell triggered formed at $490.69. LULU continued to sell until another hammer attempt occurred at the same $478.13 low on Jan. 11, 2024. This double bottom formed the flat-bottom horizontal trendline at $478.13 as the apex nears. The daily 50-period moving average support is rising at $462.57.
The daily relative strength index (RSI) continues to drift lower through the 50-band. Pullback support levels are at $478.13, $45