Wall Street has entered a state of heightened anxiety as the S&P 500 (NYSEARCA:SPY) decisively broke below its 200-day moving average on March 19, 2026, marking the first time the index has sustained a stay below this critical technical floor in over a year. As of early April, the index remains stuck in a downward trajectory, trading near 6,575—well below the 200-day line of 6,660—as institutional investors shift from "buying the dip" to aggressive capital preservation.
This technical breakdown is not an isolated event but rather the culmination of mounting geopolitical friction and deteriorating macroeconomic data. With the "Epic Fury" military campaign in the Middle East threatening global energy supplies and internal economic metrics flashing historical warnings, analysts are pointing to a rare convergence of four distinct warning signs that suggest the current market correction may transition into a prolonged bearish cycle.
The Breach: A Timeline of Technical Decay
The road to the current breakdown began in the second half of 2025. Following a brief "false break" in March 2025 caused by tariff-related volatility, the S&P 500 enjoyed a persistent bull run that lasted 214 trading days. However, the momentum began to fray in early February 2026 as the "Epic Fury" military campaign—a coalition effort led by U.S. and Israeli forces—targeted strategic facilities in Iran. The initial market reaction was a volatile lateral trade, but as fears of a Strait of Hormuz closure mounted, the selling pressure became systemic.
On March 19, the "line in the sand" finally snapped. The breach of the 200-day moving average (200-DMA) was accelerated by programmatic selling from institutional "quant" funds and pension allocators, whose risk management protocols often mandate automated liquidations when long-term trendlines are violated. Since that date, the index has failed to reclaim its previous highs, with market breadth showing that only 28% of S&P 500 constituents are currently trading above their own 50-day moving averages. This "stealth bear market" suggests that while a few mega-cap names held the index aloft through the winter, the broader market had already begun to surrender.
The Strategic Shift: Winners and Losers in a High-Risk Environment
The current environment has created a sharp divergence between sectors. The primary beneficiaries of the current volatility have been energy giants like ExxonMobil (NYSE: XOM) and Chevron (NYSE: CVX), which have surged as crude oil prices spiked past $100 per barrel due to the Middle East conflict. These companies are effectively acting as a hedge against stagflationary pressures, though their gains have been insufficient to offset the losses in the broader index. Defense contractors are also seeing increased interest as global defense budgets are adjusted for a prolonged conflict landscape.
Conversely, the technology and consumer discretionary sectors are facing a dual-threat of rising input costs and cooling demand. Tech titan Apple (NASDAQ: AAPL) and semiconductor leader NVIDIA (NASDAQ: NVDA) have faced significant headwinds as the "AI premium" begins to erode in the face of higher discount rates and supply chain uncertainty. Furthermore, Taiwan Semiconductor Manufacturing Company (NYSE: TSM) remains at the center of investor concerns; while no direct conflict has broken out in the Taiwan Strait, the "gray zone" military activities surrounding the island have forced many investors to price in a "geopolitical risk premium" that is weighing heavily on the Philadelphia Semiconductor Index.
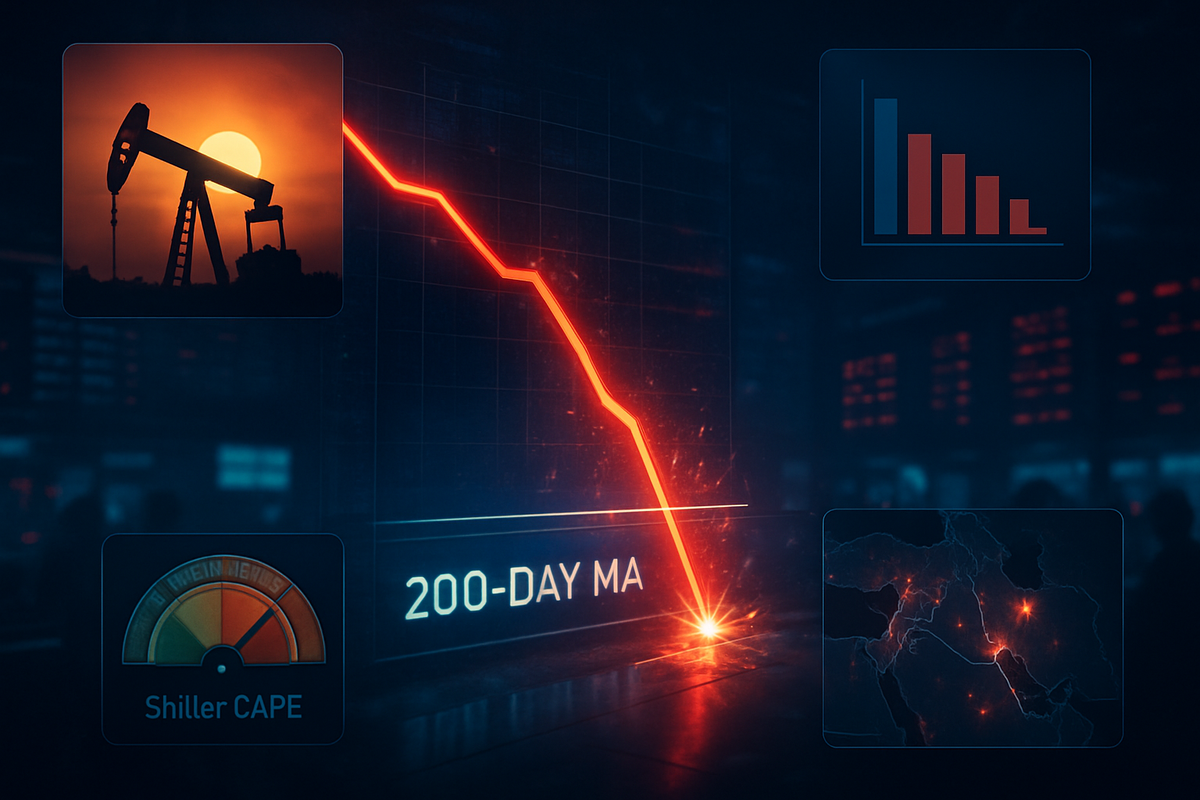
The Four Warning Signs Flashing Red
Market veterans are closely monitoring four "rare" indicators that have historically preceded every major market downturn of the last 40 years. First is the Shiller CAPE Ratio, which hit a staggering 39.7 in January—the second-highest reading in 150 years. This level of overvaluation leaves little room for error, making the current geopolitical shocks even more damaging to investor sentiment. Second is the University of Michigan Consumer Sentiment Index, which has plunged to its third-lowest reading in history, signaling that the American consumer is buckling under the weight of persistent inflation and global instability.
The third sign is the Energy Price Shock. Historically, every U.S. recession since 1980 has been preceded by a sharp rise in the price of oil. With crude now hovering comfortably in triple digits, the threat of stagflation—low growth combined with high inflation—has become the base-case scenario for many hedge fund managers. Finally, the Technical Trend Failure itself serves as the fourth warning. The breach of the 200-DMA is a psychological blow to the "buy-the-dip" mentality that has dominated the markets since the 2023 recovery, suggesting that the path of least resistance is now downward.
Navigating the Downside: What Comes Next?
The short-term outlook for the market depends heavily on whether the S&P 500 can stage a "relief rally" to test the 6,700 resistance level. Technical analysts argue that unless the index can achieve a decisive weekly close above 6,700, any upward movement should be viewed as a "dead cat bounce" rather than a true recovery. If the current support level near 6,310 fails to hold, the next major downside target is 6,150—a level that represents a key Fibonacci retracement point and the resistance-turned-support from early 2025.
In the long term, a strategic pivot toward "defensive value" may be required. Investors are increasingly looking at consumer staples and healthcare, moving away from the high-multiple growth stocks that led the market in 2024 and 2025. If the geopolitical situation in the Middle East stabilizes, we could see a rapid "mean reversion," but the historical precedents of the Shiller CAPE ratio suggest that even a diplomatic resolution may not be enough to prevent a more thorough valuation reset across the equity markets.
Final Assessment and the Path Ahead
The break below the 200-day moving average is more than just a technical glitch; it is a signal that the market's internal mechanics have shifted from optimism to caution. The combination of extreme valuations, crumbling consumer confidence, soaring energy costs, and broken technical trends creates a "perfect storm" that investors cannot afford to ignore. While the AI revolution continues to provide a long-term thematic tailwind, the immediate reality is one of deleveraging and risk-off sentiment.
As we move through the second quarter of 2026, investors should keep a close watch on three specific factors: the stability of the 6,310 support level, any signs of a ceasefire in the "Epic Fury" campaign, and the next round of corporate earnings reports. The "line in the sand" has been crossed, and the burden of proof has now shifted to the bulls. Until the S&P 500 can reclaim its long-term moving average, the market remains in a vulnerable state where every headline carries the potential to trigger the next wave of the sell-off.
This content is intended for informational purposes only and is not financial advice.