


Industrial manufacturer Standex (NYSE: SXI) beat Wall Street’s revenue expectations in Q2 CY2025, with sales up 23.2% year on year to $222 million. Its non-GAAP profit of $2.28 per share was 8.7% above analysts’ consensus estimates.
Is now the time to buy Standex? Find out by accessing our full research report, it’s free.
Standex (SXI) Q2 CY2025 Highlights:
- Revenue: $222 million vs analyst estimates of $214.4 million (23.2% year-on-year growth, 3.5% beat)
- Adjusted EPS: $2.28 vs analyst estimates of $2.10 (8.7% beat)
- Adjusted EBITDA: $51.6 million vs analyst estimates of $50.38 million (23.2% margin, 2.4% beat)
- Operating Margin: 15.6%, in line with the same quarter last year
- Free Cash Flow Margin: 11.2%, down from 12.2% in the same quarter last year
- Market Capitalization: $1.99 billion
Commenting on the quarter's results, President and Chief Executive Officer David Dunbar said, "We concluded our fiscal year with a very strong performance in the fourth quarter. Adjusted operating margin expanded 350 basis points year-on-year to a record 20.6% and adjusted earnings per share grew more than 20% to a record $2.28. These results reflect the continued evolution of our portfolio, accelerated by the acquisition of the Amran/Narayan Group in October 2024, and continued solid operational performance from core businesses. We paid down approximately $27 million of debt in the fiscal fourth quarter, and our net leverage ratio was reduced to 2.6x."
Company Overview
Holding over 500 patents globally, Standex (NYSE: SXI) is a manufacturer and distributor of industrial components for various sectors.
Revenue Growth
A company’s long-term sales performance can indicate its overall quality. Any business can experience short-term success, but top-performing ones enjoy sustained growth for years. Over the last five years, Standex grew its sales at a tepid 5.5% compounded annual growth rate. This fell short of our benchmark for the industrials sector and is a rough starting point for our analysis.
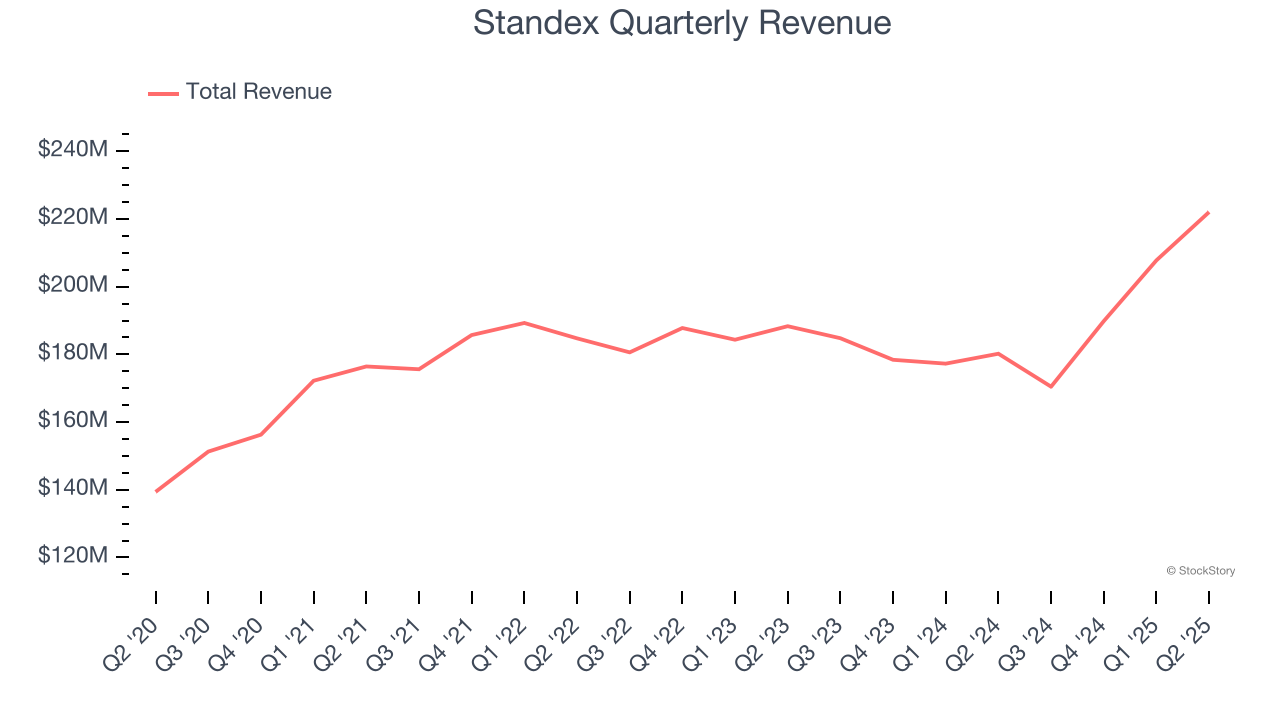
Long-term growth is the most important, but within industrials, a half-decade historical view may miss new industry trends or demand cycles. Standex’s recent performance shows its demand has slowed as its annualized revenue growth of 3.3% over the last two years was below its five-year trend. 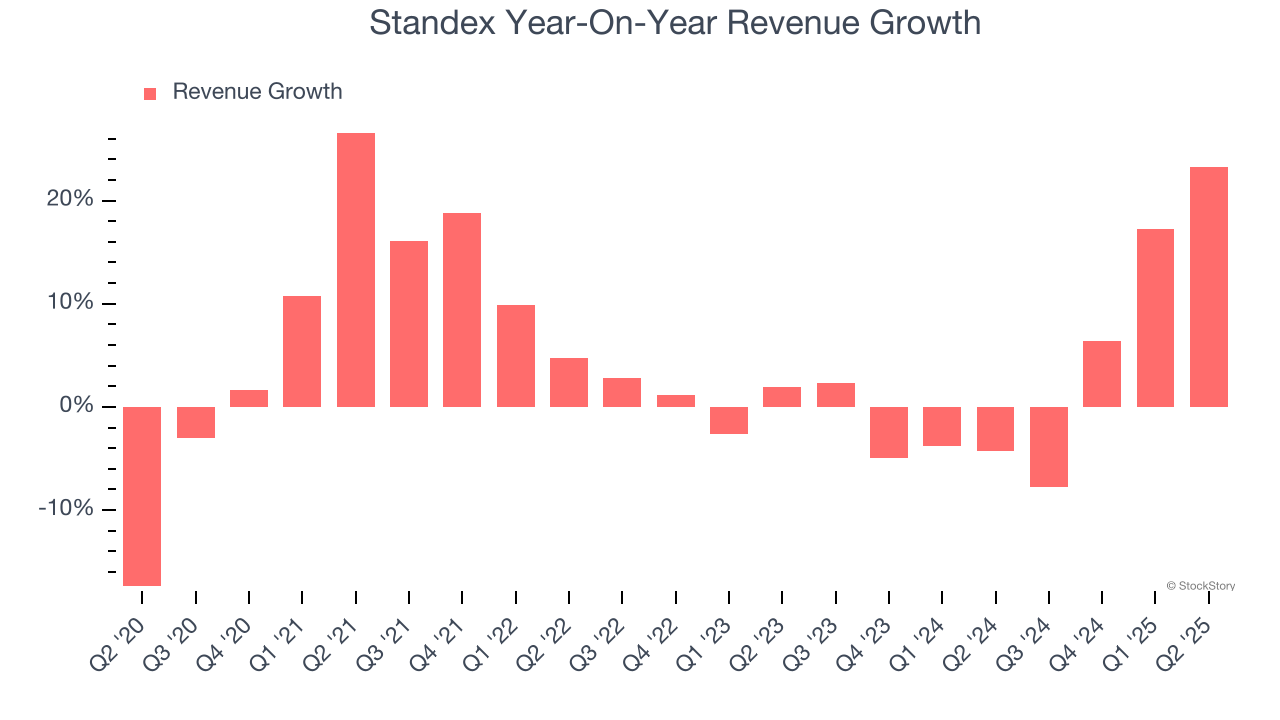
This quarter, Standex reported robust year-on-year revenue growth of 23.2%, and its $222 million of revenue topped Wall Street estimates by 3.5%.
Looking ahead, sell-side analysts expect revenue to grow 10.8% over the next 12 months, an improvement versus the last two years. This projection is commendable and indicates its newer products and services will spur better top-line performance.
Unless you’ve been living under a rock, it should be obvious by now that generative AI is going to have a huge impact on how large corporations do business. While Nvidia and AMD are trading close to all-time highs, we prefer a lesser-known (but still profitable) stock benefiting from the rise of AI. Click here to access our free report one of our favorites growth stories.
Operating Margin
Standex has been an efficient company over the last five years. It was one of the more profitable businesses in the industrials sector, boasting an average operating margin of 14.3%. This result isn’t surprising as its high gross margin gives it a favorable starting point.
Analyzing the trend in its profitability, Standex’s operating margin rose by 3 percentage points over the last five years, as its sales growth gave it operating leverage.
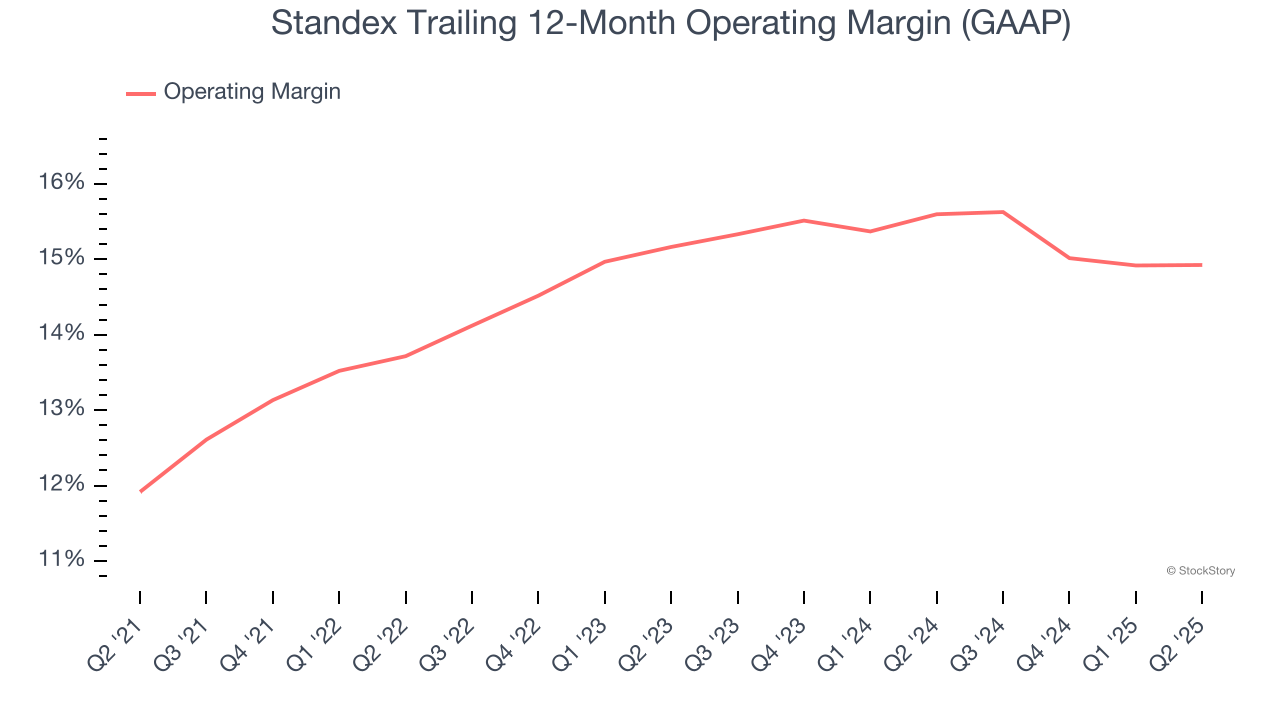
In Q2, Standex generated an operating margin profit margin of 15.6%, in line with the same quarter last year. This indicates the company’s cost structure has recently been stable.
Earnings Per Share
Revenue trends explain a company’s historical growth, but the long-term change in earnings per share (EPS) points to the profitability of that growth – for example, a company could inflate its sales through excessive spending on advertising and promotions.
Standex’s EPS grew at a spectacular 16.8% compounded annual growth rate over the last five years, higher than its 5.5% annualized revenue growth. This tells us the company became more profitable on a per-share basis as it expanded.
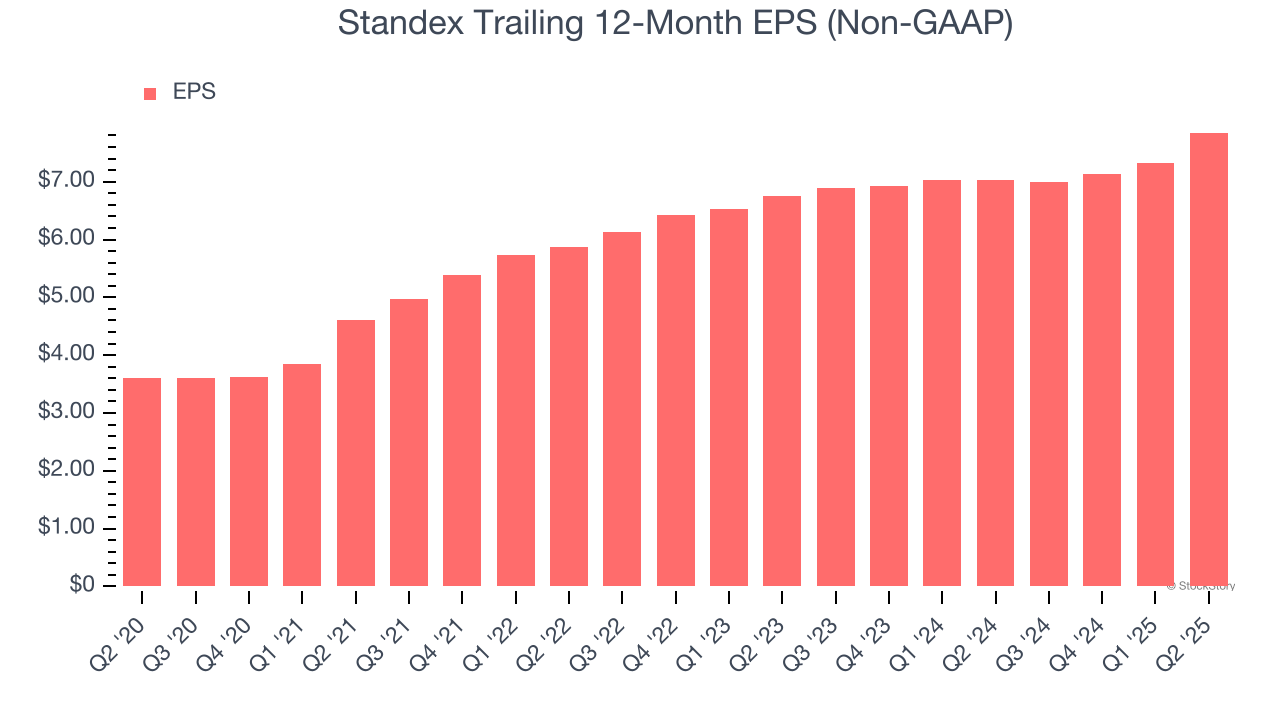
We can take a deeper look into Standex’s earnings quality to better understand the drivers of its performance. As we mentioned earlier, Standex’s operating margin was flat this quarter but expanded by 3 percentage points over the last five years. On top of that, its share count shrank by 1.7%. These are positive signs for shareholders because improving profitability and share buybacks turbocharge EPS growth relative to revenue growth. 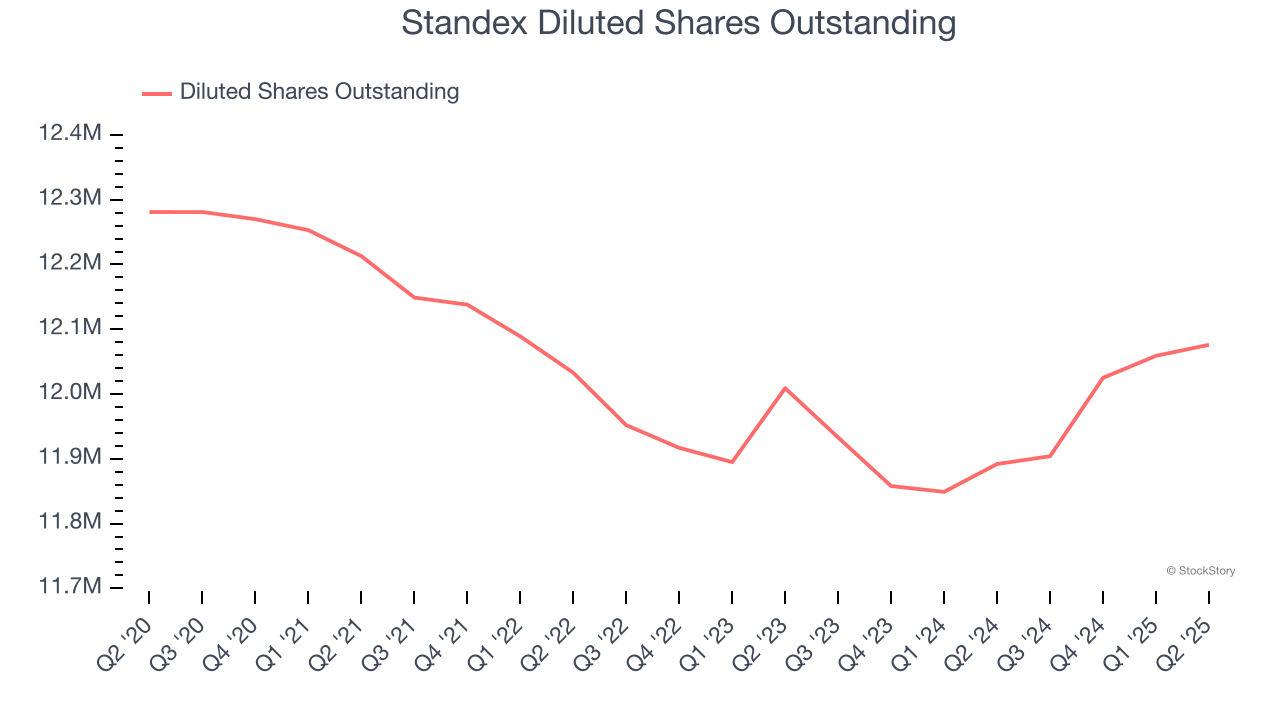
Like with revenue, we analyze EPS over a more recent period because it can provide insight into an emerging theme or development for the business.
For Standex, its two-year annual EPS growth of 7.8% was lower than its five-year trend. We hope its growth can accelerate in the future.
In Q2, Standex reported adjusted EPS at $2.28, up from $1.76 in the same quarter last year. This print beat analysts’ estimates by 8.7%. Over the next 12 months, Wall Street expects Standex’s full-year EPS of $7.85 to grow 9.1%.
Key Takeaways from Standex’s Q2 Results
We were impressed by how significantly Standex blew past analysts’ revenue expectations this quarter. We were also happy its EPS and EBITDA outperformed Wall Street’s estimates. Zooming out, we think this was a good print with some key areas of upside. The stock remained flat at $164.74 immediately after reporting.
Is Standex an attractive investment opportunity at the current price? We think that the latest quarter is only one piece of the longer-term business quality puzzle. Quality, when combined with valuation, can help determine if the stock is a buy. We cover that in our actionable full research report which you can read here, it’s free.


