Gold just did something traders have waited months for. A clean, “textbook” bounce off the 200-day moving average.
That level has historically acted as a major line in the sand — including the last time we saw this in late 2023, which led to a strong upside run. But what makes this current setup different is something most traders aren’t paying attention to:
Gold technically entered a bear market… while still holding above the 200-day. That combination doesn’t happen often.
The Rare Setup: A Bear Market Above the 200-Day
In most markets, once an asset enters a bear phase (generally defined as 20% off the highs), it breaks key trend levels — especially the 200-day moving average.
But recently, gold (GCM26) did the opposite. It pulled back sharply, yet still respected the long-term trend.
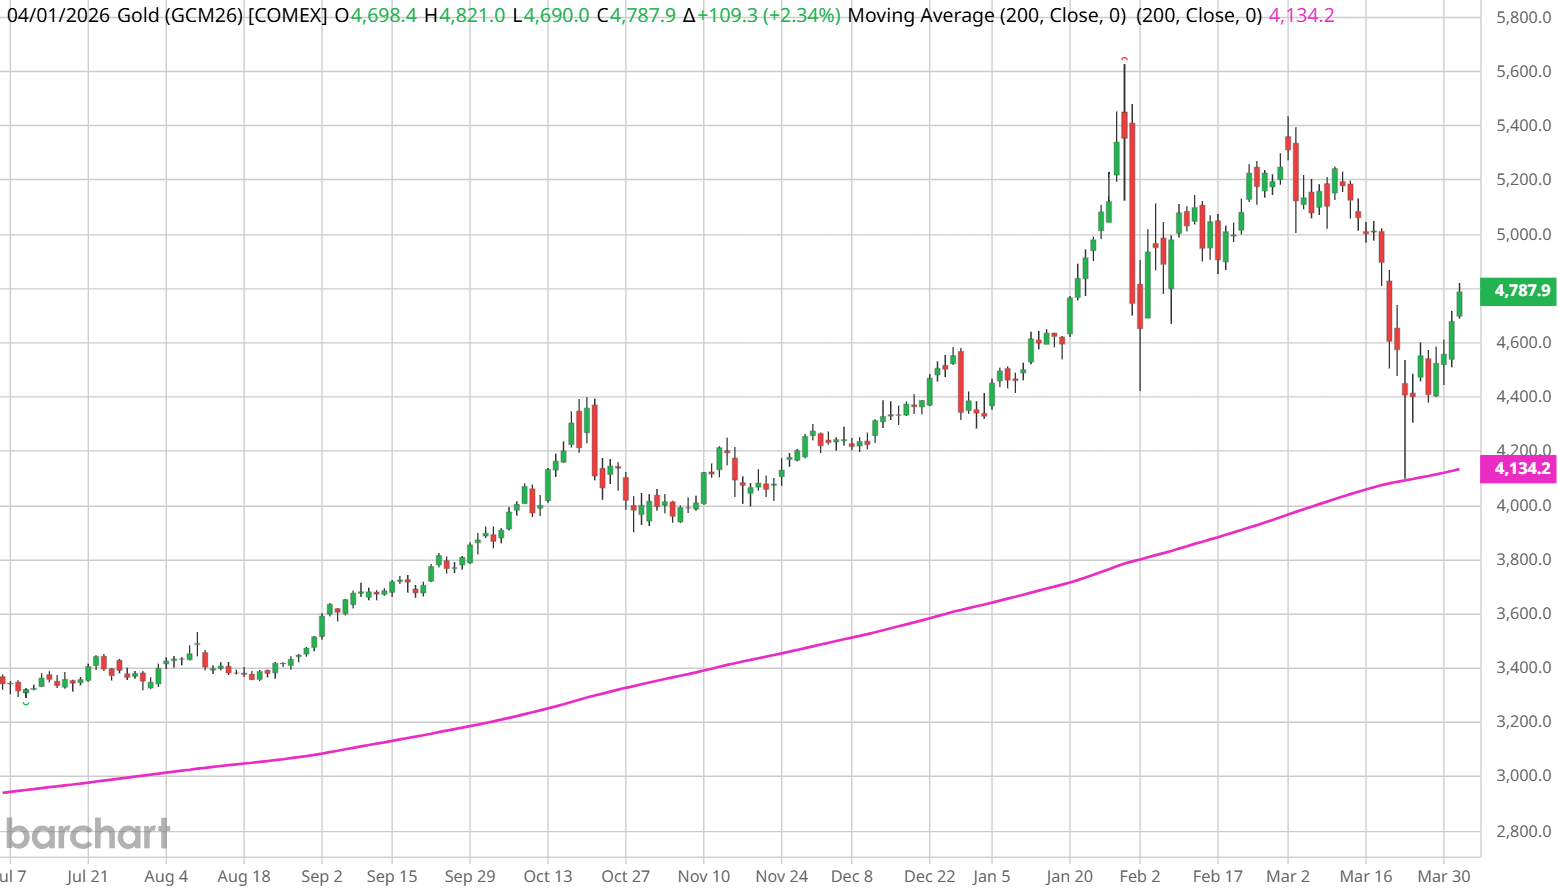
That tells you one thing: The trend hasn’t fully broken, but the momentum has. And that’s where things get interesting.
Was the Bounce Real, or Just Noise?
Before chasing the move, there’s one factor traders need to understand: Futures roll over.
As futures contracts shift (April → June), price action can look like a selloff or bounce when it’s actually just positions being adjusted. That means part of this “bounce” could be structural — not purely demand-driven.
This is where most traders get trapped:
- They see the bounce
- Assume the bottom is in
- Enter too early
Instead, the focus should shift to confirmation.
The Level That Actually Matters Now
According to Senior Market Strategist John Rowland, CMT, the key isn’t the bounce. It’s what happens next.
For trading using SPDR Gold Shares ETF (GLD) as a proxy, the critical resistance level to watch sits around $435.
That’s the level where:
- Previous positioning was exited
- Resistance is clearly defined
- A breakout would confirm strength returning
Until that level is reclaimed, this is still a market in transition, not a confirmed reversal.
The Bottom Line
Gold gave traders exactly what they look for: a clean bounce off the 200-day. But this isn’t a confirmed bottom yet.
Right now, the setup is:
- Structurally strong (holding trend)
- Momentum is weak (recent selloff)
- Awaiting confirmation (key resistance ahead)
That’s why the current approach is simple: Wait, don’t chase. Because in markets like this, the move isn’t made at support. It’s made after confirmation.
Watch this clip on Gold:
- Stream the full Market on Close episode
- Track gold using Barchart’s Futures Market Overview & Gold Stocks Watchlist
On the date of publication, Barchart Insights did not have (either directly or indirectly) positions in any of the securities mentioned in this article. All information and data in this article is solely for informational purposes. For more information please view the Barchart Disclosure Policy here.
More news from Barchart