For decades, Nike (NKE) was the gold standard of both performance and culture. It didn’t just sell sneakers. It sold the Just Do It concept, and did so in every corner of the globe.
But now, NKE is confronting one of the most difficult identity crises in its 60-plus year history. The stock has spent the last several years in a structural decline, losing more than half its value since its 2021 peak.
The story of how Nike lost its balance is a cautionary tale of corporate over-optimization. Under previous leadership, the company pivoted sharply toward a direct-to-consumer (DTC) model, cutting ties with long-term wholesale partners like Foot Locker and Macy’s (M) in favor of its own apps and website.
While this moved margins higher on paper, it created a massive innovation vacuum. By pulling back from the physical store shelves where runners and athletes actually shop, Nike allowed nimble, specialized rivals like Hoka and On Running (ONON) to sprint into the gap. Nike became a lifestyle brand focused on re-releasing retro sneakers while its competitors became the new authorities in actual performance technology.
NKE essentially abandoned its throne for others to take. And they did. So, now what?
What NKE’s Stock Price Chart Tells Us About the Future
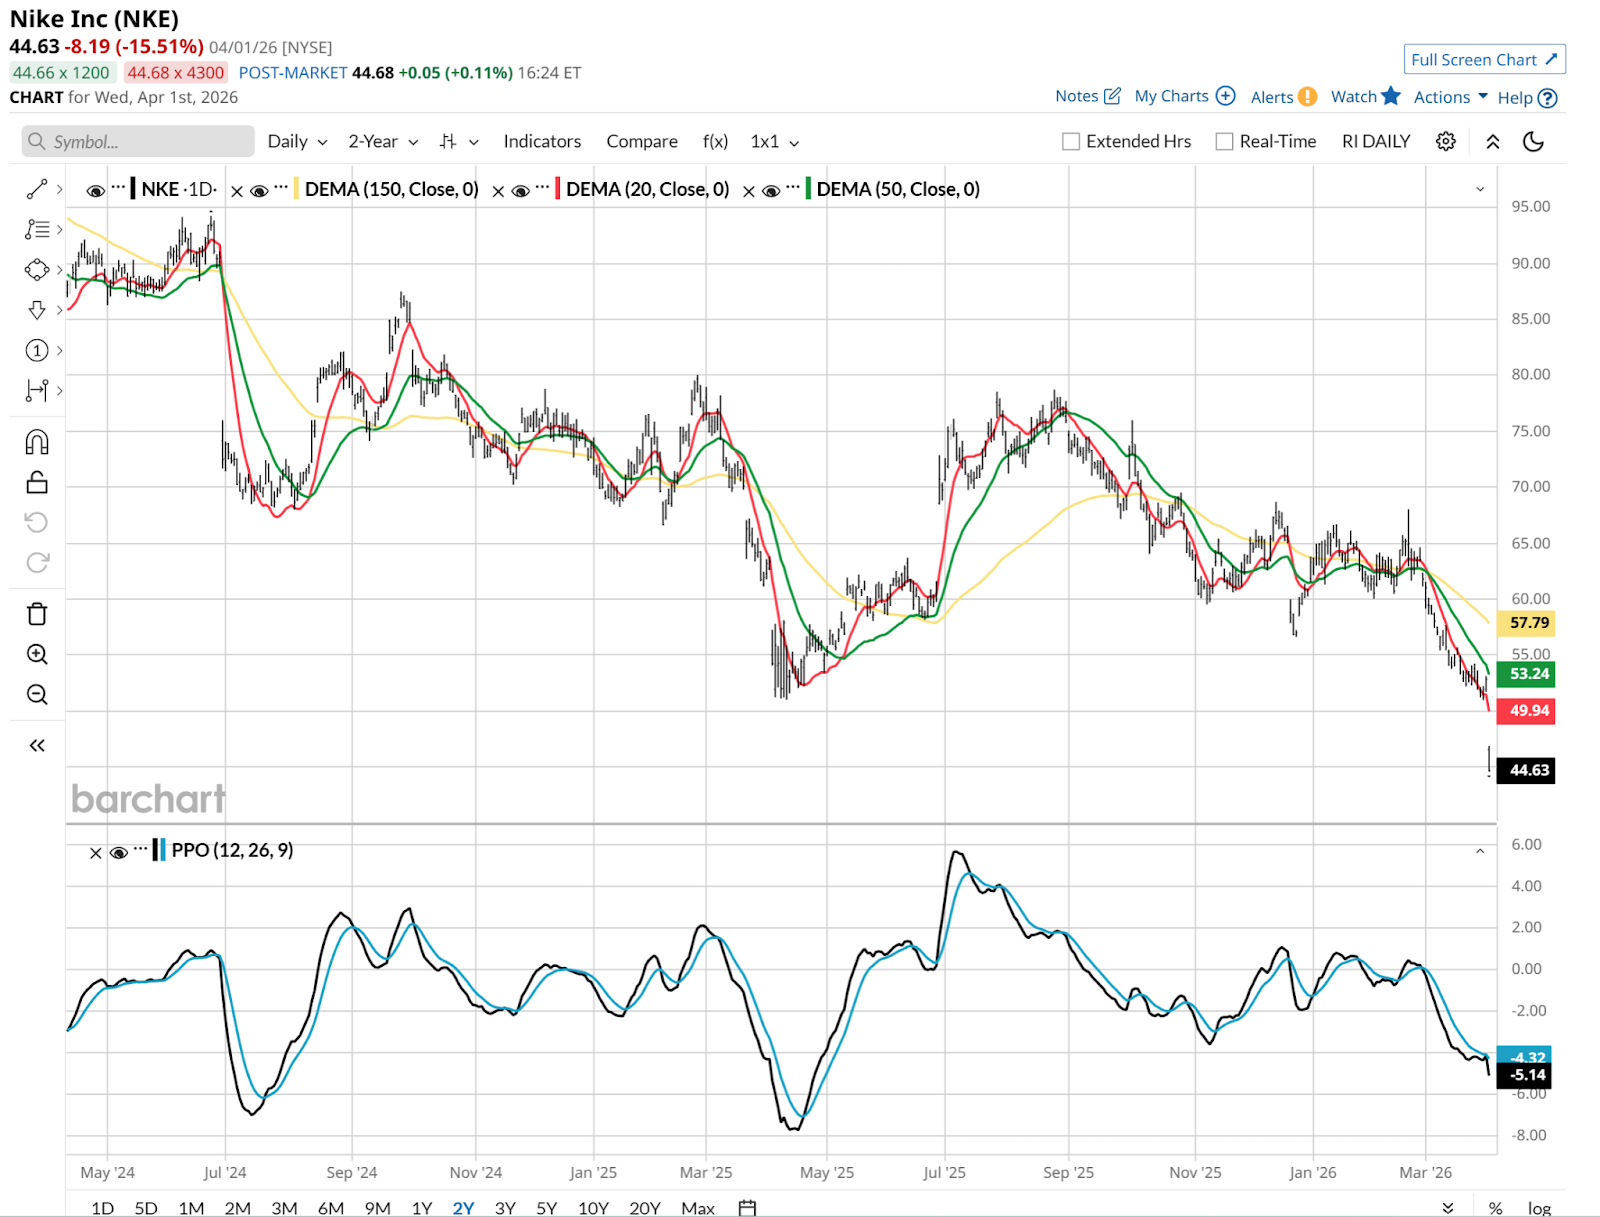
The daily chart looks as bad as you’d expect. A more than 15% loss on Wednesday, April 1 was the latest gap down for the stock. The 20-day moving average and PPO peaked nearly 8 months ago.
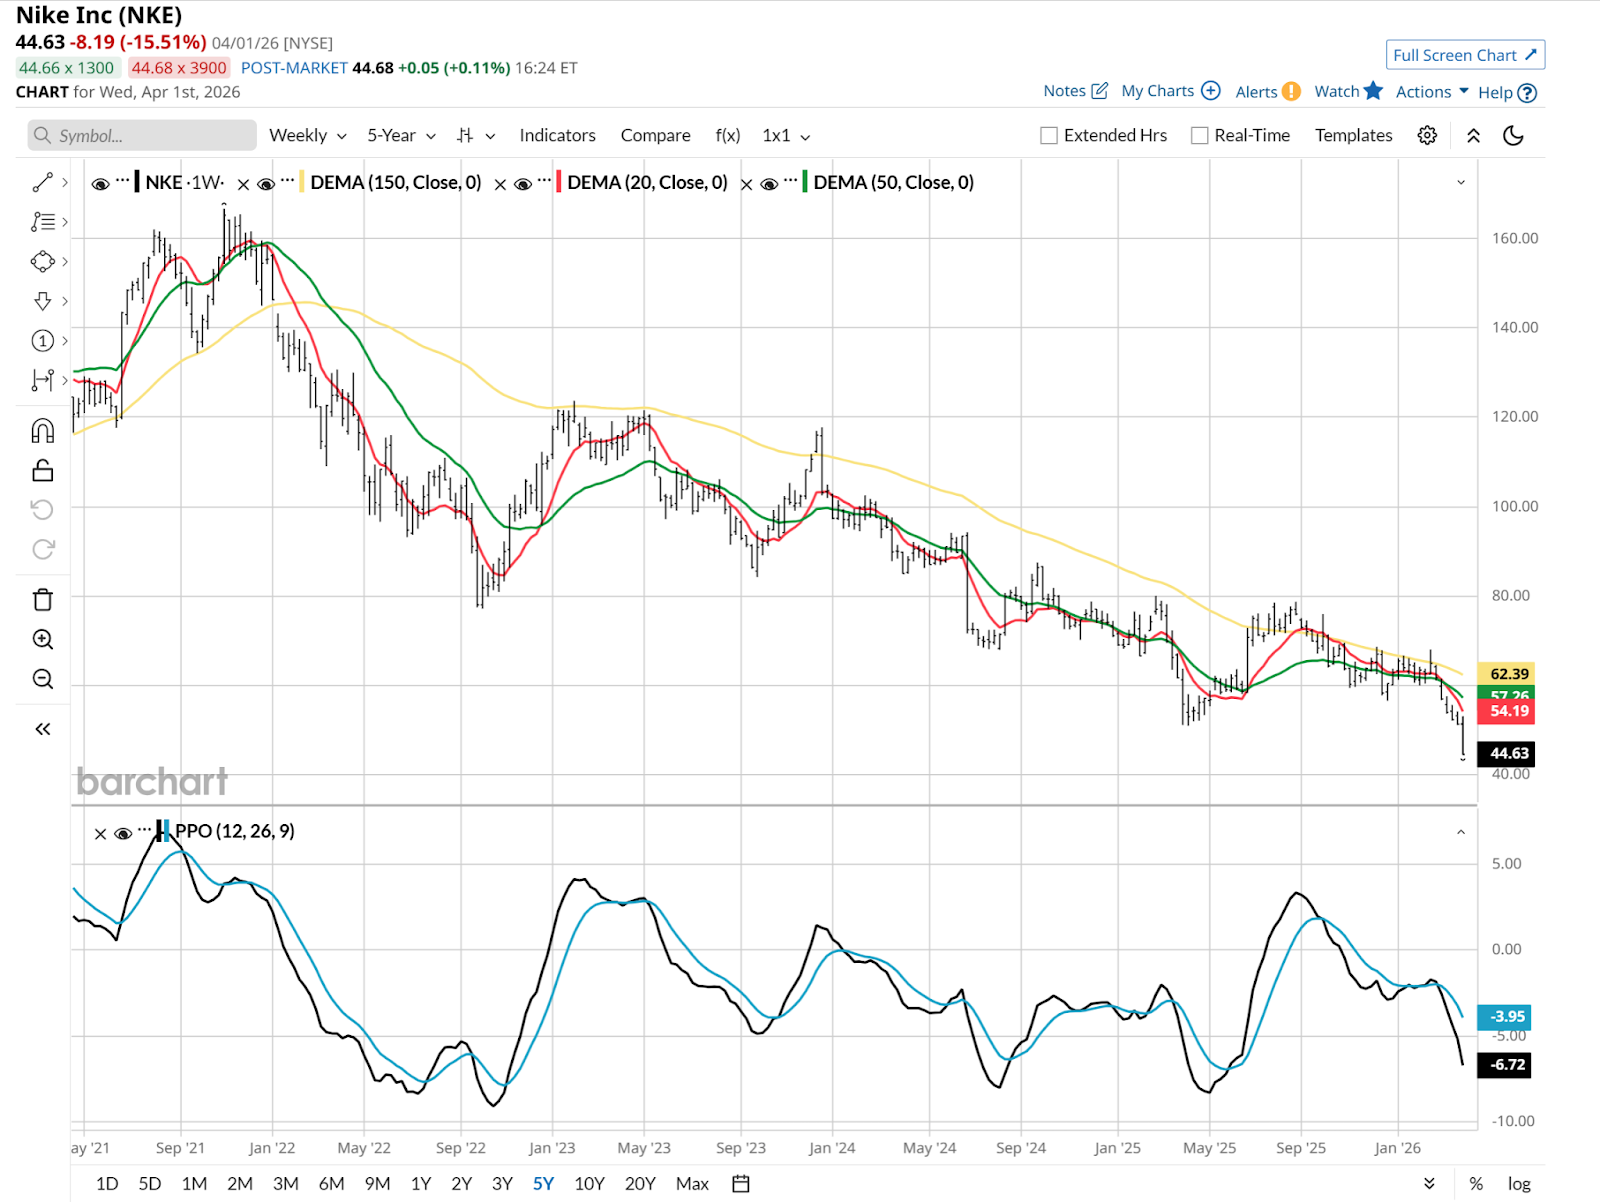
The weekly chart below is where I typically look for solace, for comfort that it might all be OK. I can’t find it here. Nike’s weekly chart is just as tough as the daily.
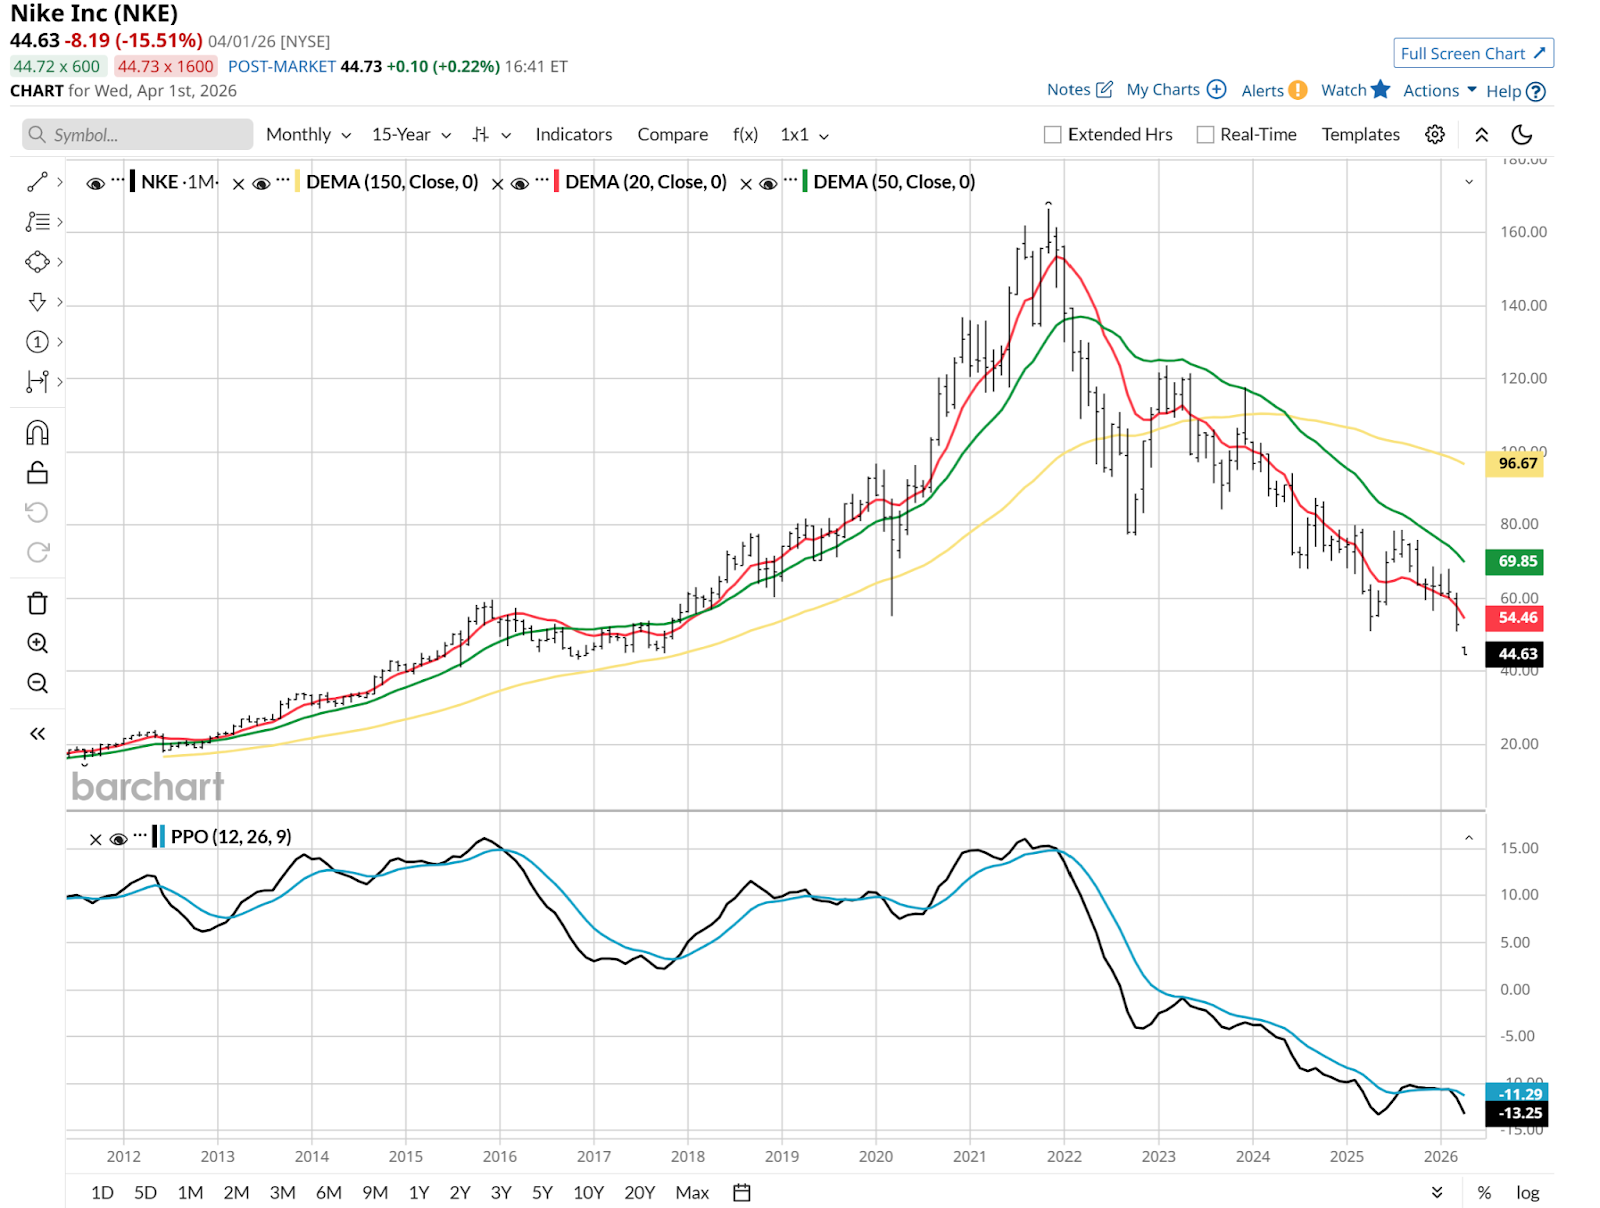
I am not showing you this monthly chart of NKE because it solves the problem of a poor technical look for the stock. It doesn’t. I’m showing it because this is how far back we need to go to see that NKE now trades at the same price per share it did during 2015!
The turnaround, if there is one, has been delayed in the eyes of many investors. But there’s something about “fallen angels” like NKE that makes me move up a bit in my chair. Not to own it outright, but to collar it with options.
NKE: Managing Risk and Collaring the Stock
I pulled up NKE’s ROAR Score, not expecting it to be very high, and to signal above-average risk. No surprise there.
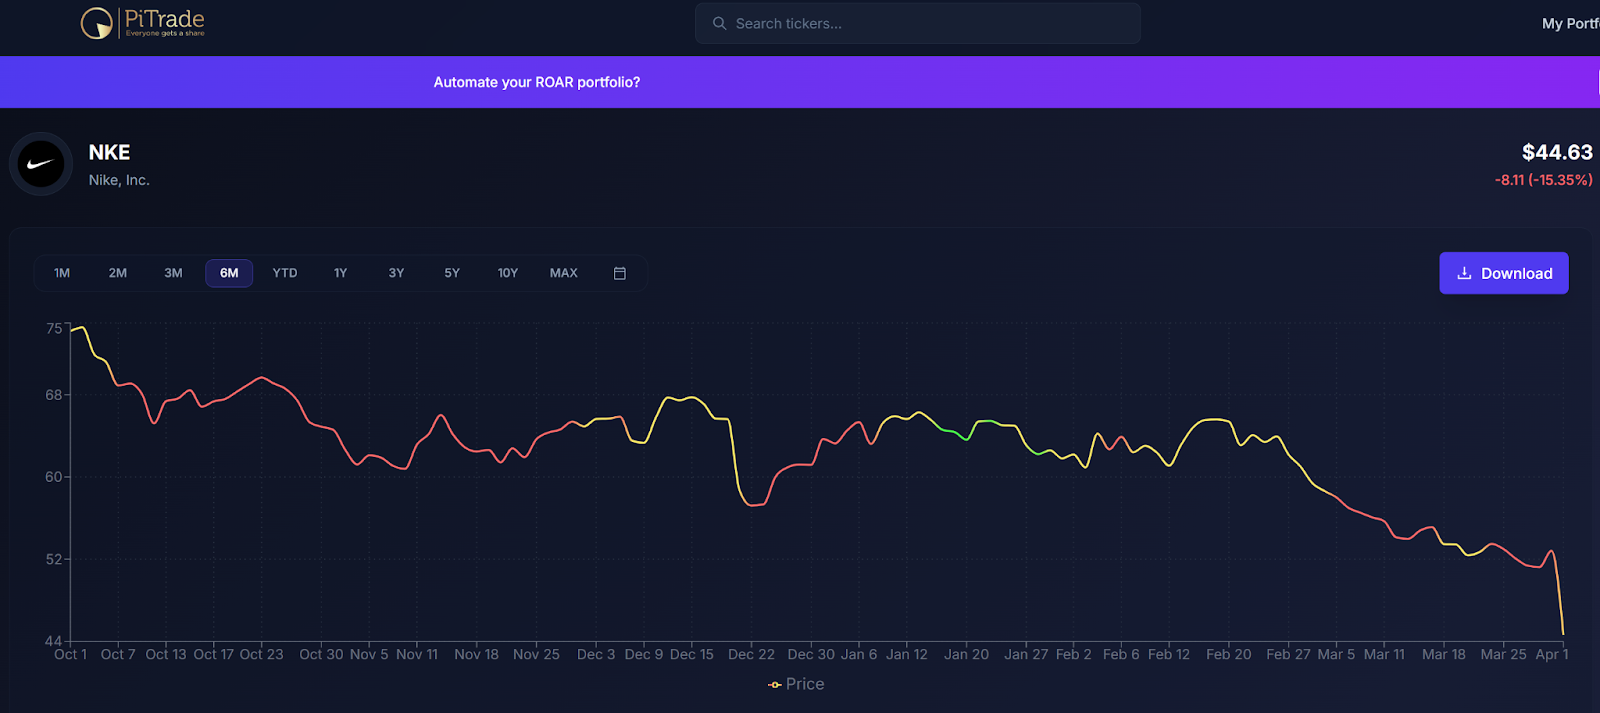
But I will point out that it has been solid red (higher risk signal) for the better part of 6 months. And almost entirely during the stock’s latest cratering from $58 on March 5 through its close below $45 on Wednesday. As a reminder of how I think, my first priority is to avoid big losses. My second is to try and make as much money as I can.
And that prompts me to show a collar example for a stock that has no business being a “buy” on a technical basis. But when there’s an iconic brand, a blue-chip stock, down more than 70% from its peak price, and I can still own it with a downside risk level I define myself? “Just Do It” sings in my ears.

There are many possible collar combinations with a stock that has been through what NKE shareholders have. So here’s one sample trade setup. Both purchased put and covered call go out to January 2027. Strike prices of the call and put, respectively, are $60 and $45. That costs 10%, which for a volatile stock like this, is not huge to me. And my upside/downside is about 25%/9%. Nearly 3:1.
This is one of those “go big or go home” trades. But when the downside is limited to single digits in percentage terms, I like the tradeoff.
Rob Isbitts created the ROAR Score, based on his 40+ years of technical analysis experience. ROAR helps DIY investors manage risk and create their own portfolios. For Rob's written research, check out ETFYourself.com.
On the date of publication, Rob Isbitts did not have (either directly or indirectly) positions in any of the securities mentioned in this article. All information and data in this article is solely for informational purposes. For more information please view the Barchart Disclosure Policy here.
More news from Barchart
- Trade Strait of Hormuz Headlines and Profit with Unusual Options Activity in Royal Caribbean Stock
- Nvidia Still Looks Cheap - Shorting Out-of-the-Money NVDA Put Options Is Attractive
- 1 Low-Risk, High-Reward Way to ‘Just Do It’ and Trade Nike Stock with Options
- Trade Unusually Active Options in Google Stock with This Covered Ratio Spread