- Q3 2021 operating results consistent with expectations and full-year total spending guidance unchanged.
- Successful Green Convertible Bond offering in August bolstered cash balance to $1.40 billion as of September 30, 2021 compared to $962 million as of June 30, 2021.
- Secured long-term commitment for over 5 GWh’s of initial annual battery supply from global leader CATL with mechanisms in place to expand over time. Dual pack / chemistry strategy enables Fisker to optimize performance, application, cost, and market position across the Fisker Ocean lineup.
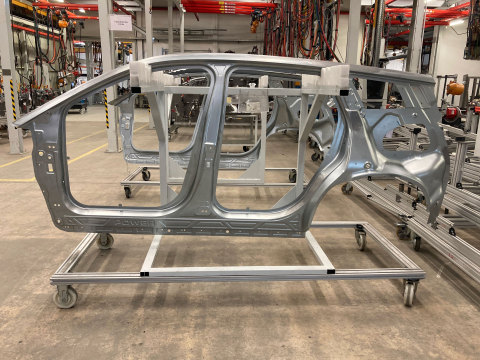
- Test and validation phase progressing well, with prototype body shop production now operational and ongoing at Fisker Ocean’s assembly facility.
- Secured lease for flagship experience center in Los Angeles.
Fisker Inc. (NYSE: FSR) (“Fisker”) -- passionate creator of the world's most sustainable electric vehicles and advanced mobility solutions -- today announced its financial results for the third quarter ended September 30, 2021.
This press release features multimedia. View the full release here: https://www.businesswire.com/news/home/20211103006141/en/

Prototype testing and validation of the Fisker Ocean has been underway for some time, with the “Mule 1” build completed and “Mule 2” testing progressing as planned. The prototype Body Shop at the Fisker Ocean assembly facility in Austria is fully operational and production of prototype bodies for the next phase of testing has begun. (Photo: Business Wire)
“We continued to make rapid progress in Q3 2021 on our core focus, achieving program milestones that ensure we execute Fisker Ocean SUV on-time and with several segment-leading features. We are very excited to provide details and kick off our marketing activities at the L.A. Auto Show two weeks from today,” stated Henrik Fisker, Chairman and Chief Executive Officer of Fisker.
“The critical sourcing phase for Fisker Ocean is now largely complete, and we capped that off by announcing a long-term committed battery supply agreement earlier this week. We are now fully engaged with industrialization, including an extensive prototyping phase that has been steadily ramping up. On the PEAR program, we are leveraging the FF-PAD development process and developing unique opportunities for component-sharing that benefits from Ocean development IP and engineering, development, and validation learnings,” continued Fisker.
Third Quarter 2021 Business Highlights:
- Bolstered balance sheet with a successful offering of 2.5% Green Convertible Senior Notes due 2026 raising gross proceeds of $667.5 million. Simultaneously entered into capped call contracts with an effective conversion price of $32.57.
- Fisker Ocean sourcing largely complete. As of today, serial production sourcing of over 90% of the Bill of Materials (BOM) is complete. The remainder is almost exclusively off-the-shelf items.
- Prototype testing and validation has been underway for some time, with the “Mule 1” build completed and “Mule 2” testing progressing as planned. The prototype Body Shop at the Fisker Ocean assembly facility in Austria is fully operational and production of prototype bodies for the next phase of testing has begun, as shown in the photos in this release.
- Grew Customer Experience teams significantly across the marketing, sales, service, logistics, and customer relations functions, and took necessary steps to ensure that the Fisker customer experience will be as high-quality as Fisker’s products.
- On the ESG side, progressed on plan to be the first EV SUV to have a full “cradle to cradle” Lifecycle Analysis (LCA), following ISO standards, and using predominantly primary data.
- Implemented an enhanced, goal-oriented performance incentive program for 100% of employees to further align and incentivize all Fisker team members behind the shared goal of achieving on-time Fisker Ocean Start of Production (SOP) in November 2022 and targets during the 2023 ramp-up.
Recent Updates:
- Affirming the expected timing plan for Fisker Ocean start-of-production.
- Completed a long-term battery supply agreement with CATL, the largest global supplier of automotive lithium-ion batteries (read more here). Advanced cell / pack design plus dual chemistry strategy enables Fisker Ocean Sport (base version) to achieve compelling pricing and a driving range consistent with many higher-priced vehicles. And supports segment-benchmark driving range on the longer-range versions of Fisker Ocean.
- Identified incremental opportunities to share components among Fisker Ocean and Fisker PEAR, leveraging intellectual property developed for the Ocean architecture.
- Secured lease for flagship experience center in Los Angeles. In the process of planning and designing the customer experience and the store will be unveiled in early 2022.
- Recruitment remains brisk and at targeted pace, with headcount tripling to over 300 full-time employees as of November 2, 2021 from 101 as of December 31, 2020.
- Reservations are over 18,600 as of November 2, 2021 (net of cancellations), including 1,400 fleet reservations. App registrations are over 72,000. Growth in reservations, registrations, and registration conversions is expected to accelerate once detailed performance, specifications, and pricing are released, and planned marketing campaigns begin, at the upcoming L.A. Auto Show.
Third Quarter 2021 Financial Highlights:
- Cash and cash equivalents of $1.40 billion as of September 30, 2021.
- Loss from operations totaled $109.6 million, including $1.0 million of stock-based compensation expense.
- Net loss totaled $109.8 million and $0.37 loss per share.
- Net cash used in operating activities totaled $103.4 million and cash paid for capital expenditures totaled $15.8 million.
- Weighted average shares outstanding totaled 296.1 million for the quarter.
2021 Business Outlook
The following information reflects Fisker’s expectations for key non-GAAP operating expenses and capital expenditures for the full-year 2021. Fisker is projecting the total of these items to be within a range of $490 million to $530 million, consistent with our prior expectations last provided in the Q2 2021 Earnings Release.
| Expense item | USD, millions | ||
| Research & Development (Non-GAAP)1 | 280 - 290 |
||
| Selling, General, and Administrative (Non-GAAP)1 | 45 - 50 |
||
| Total Operating Expenses (Non-GAAP)1 | 325 - 340 |
||
| Capital Expenditures | 165 - 190 |
1Excludes stock-based compensation expense. A reconciliation to the corresponding GAAP amount is not provided as the quantification of stock-based compensation excluded from the non-GAAP measure, which may be significant, cannot be reasonably calculated or predicted without unreasonable efforts. The Non-GAAP adjustment for stock-based compensation expense requires additional inputs such as number of shares granted and market price volatilities that are not currently ascertainable.
Conference Call Information
Fisker Inc. will host a conference call to discuss the results at 2:00 p.m. Pacific Time (5:00 p.m. Eastern Time) today, November 3, 2021. The live audio webcast, along with supplemental information, will be accessible on Fisker’s Investor Relations website at https://investors.fiskerinc.com. A recording of the webcast will also be available following the conference call.
Use of Non-GAAP Financial Measures (Unaudited)
This press release and the accompanying tables references certain non-generally accepted accounting principles in the United States (GAAP) financial measures, including non-GAAP adjusted loss from operations, non-GAAP selling, general, and administrative expense, non-GAAP research and development expense and non-GAAP total operating expenses. These non-GAAP financial measures differ from their directly comparable GAAP financial measures due to adjustments made to exclude stock-based compensation expense. None of these non-GAAP financial measures is a substitute for or superior to measures of financial performance prepared in accordance with GAAP and should not be considered as an alternative to any other performance measures derived in accordance with GAAP.
Fisker believes that presenting these non-GAAP financial measures provides useful supplemental information to investors about Fisker in understanding and evaluating its operating results, enhancing the overall understanding of its past performance and future prospects, and allowing for greater transparency with respect to key financial metrics used by its management in financial and operational-decision making. However, there are a number of limitations related to the use of non-GAAP measures and their nearest GAAP equivalents. For example, other companies may calculate non-GAAP measures differently, or may use other measures to calculate their financial performance, and therefore any non-GAAP measures Fisker uses may not be directly comparable to similarly titled measures of other companies. Therefore, both GAAP financial measures of Fisker's financial performance and the respective non-GAAP measures should be considered together. Please see the reconciliation of non-GAAP financial measures to the most directly comparable GAAP measure in the tables below.
Disclosure Information
Fisker uses the investor relations section on its website as a means of complying with its disclosure obligations under Regulation FD. It also uses various social media channels as a means of disclosing information about Fisker and its products to its customers, investors and the public (e.g., @fiskerinc, @fiskerofficial, #fiskerinc, #henrikfisker and #fisker on Twitter, Facebook, Instagram, YouTube, TikTok and LinkedIn). Accordingly, investors should monitor Fisker's investor relations website and social media channels in addition to following Fisker's press releases, SEC filings, and public conference calls and webcasts.
About Fisker Inc.
California-based Fisker Inc. is revolutionizing the automotive industry by developing the most emotionally desirable and eco-friendly electric vehicles on Earth. Passionately driven by a vision of a clean future for all, the company is on a mission to become the No. 1 e-mobility service provider with the world’s most sustainable vehicles. To learn more, visit www.Fiskerinc.com – and enjoy exclusive content across Fisker’s social media channels: Facebook, Instagram, Twitter, YouTube and LinkedIn. Download the revolutionary new Fisker mobile app from the App Store or Google Play store.
Forward-Looking Statements
This press release includes forward-looking statements, which are subject to the “safe harbor” provisions of the U.S. Private Securities Litigation Reform Act of 1995. These statements may be identified by words such as “feel,” “believes,” expects,” “estimates,” “projects,” “intends,” “should,” “is to be,” or the negative of such terms, or other comparable terminology and include, among other things, the quotations of our Chief Executive Officer and statements regarding Fisker’s future performance under " 2021 Business Outlook," the reported financial results for the third quarter, which are subject to completion of Fisker’s internal review, and other future events that involve risks and uncertainties. Such forward-looking statements are not guarantees of future performance and are subject to risks and uncertainties, which could cause actual results to differ materially from the forward-looking statements contained herein due to many factors, including, but not limited to: the completion of procedures and controls associated with Fisker’s year-end financial reporting, including all the customary reviews, audit and approvals; Fisker’s limited operating history; Fisker’s ability to enter into additional agreements, as necessary, with Magna, Foxconn, or other original equipment manufacturers (“OEMs”) or tier-one suppliers in order to execute on its business plan; the risk that OEM and supply partners do not meet agreed upon timelines or experience capacity constraints; the risk that OEM and supply partners experience supply chain shortages for Fisker vehicle components now or in the future; Fisker may experience significant delays in the design, manufacture, regulatory approval, launch and financing of its vehicles; Fisker’s ability to execute its business model, including market acceptance of its planned products and services; Fisker’s inability to retain key personnel and to hire additional personnel; competition in the electric vehicle market; Fisker’s inability to develop a sales distribution network; the ability to protect its intellectual property rights; and those factors discussed in Fisker’s Annual Report on Form 10-K/A, and any subsequent Quarterly Reports on Form 10-Q under the heading “Risk Factors,” filed with the Securities and Exchange Commission (the “SEC”) and other reports and documents Fisker files from time to time with the SEC. Any forward-looking statements speak only as of the date on which they are made, and Fisker undertakes no obligation to update any forward-looking statement to reflect events or circumstances after the date of this press release.
Third Quarter 2021 Financial Results
Fisker Inc. and Subsidiaries Unaudited Condensed Consolidated Statements of Operations (amounts in thousands, except share and per share data) |
||||||||||||
Three Months Ended |
||||||||||||
September 30, 2021 |
June 30, 2021 |
September 30, 2020 |
||||||||||
| Revenue | $ |
15 |
|
$ |
27 |
|
$ |
- |
|
|||
| Costs of goods sold |
|
16 |
|
|
14 |
|
|
- |
|
|||
| Gross margin |
|
(1 |
) |
|
13 |
|
|
- |
|
|||
| Operating costs and expenses: | ||||||||||||
| General and administrative |
|
10,273 |
|
|
7,908 |
|
|
6,521 |
|
|||
| Research and development |
|
99,291 |
|
|
45,245 |
|
|
3,402 |
|
|||
| Total operating costs and expenses |
|
109,564 |
|
|
53,153 |
|
|
9,923 |
|
|||
| Loss from operations |
|
(109,565 |
) |
|
(53,140 |
) |
|
(9,923 |
) |
|||
| Other income (expense): | ||||||||||||
| Other income (expense) |
|
(84 |
) |
|
104 |
|
|
7 |
|
|||
| Interest income |
|
155 |
|
|
- |
|
|
8 |
|
|||
| Interest expense |
|
(2,147 |
) |
|
- |
|
|
(765 |
) |
|||
| Changes in fair value - embedded derivative |
|
- |
|
|
6,814 |
|
|
(29,149 |
) |
|||
| Foreign currency gain (loss) |
|
1,797 |
|
|
- |
|
|
159 |
|
|||
| Total other income (expense) |
|
(279 |
) |
|
6,918 |
|
|
(29,740 |
) |
|||
| Net loss | $ |
(109,844 |
) |
$ |
(46,222 |
) |
$ |
(39,663 |
) |
|||
| Basic and Diluted net loss per share | $ |
(0.37 |
) |
$ |
(0.16 |
) |
$ |
(0.38 |
) |
|||
| Basic and Diluted weighted average common shares outstanding |
|
296,133,530 |
|
|
295,275,773 |
|
|
105,549,787 |
|
|||
Fisker Inc. and Subsidiaries Unaudited Condensed Consolidated Balance Sheets (amounts in thousands, except share and per share data) |
||||||
| As of: | ||||||
September 30, 2021 |
December 31, 2020 |
|||||
| Current assets: | ||||||
| Cash and cash equivalents | $ |
1,400,411 |
$ |
991,158 |
||
| Prepaid expenses and other current assets |
|
22,856 |
|
9,872 |
||
| Total current assets |
|
1,423,267 |
|
1,001,030 |
||
| Non-current assets: | ||||||
| Property and equipment, net |
|
18,558 |
|
945 |
||
| Right of use asset, net |
|
19,178 |
|
2,548 |
||
| Other non-current assets |
|
1,352 |
|
1,329 |
||
| Intangible asset |
|
200,089 |
|
58,041 |
||
| Total noncurrent assets |
|
239,177 |
|
62,863 |
||
| Total assets | $ |
1,662,444 |
$ |
1,063,893 |
||
| Current liabilities: | ||||||
| Accounts payable | $ |
13,142 |
$ |
5,159 |
||
| Accrued expenses |
|
60,198 |
|
7,408 |
||
| Lease liabilities (short term) |
|
4,023 |
|
655 |
||
| Founders demand note payable |
|
- |
|
- |
||
| Total current liabilities |
|
77,363 |
|
13,222 |
||
| Non-current liabilities: | ||||||
| Customer deposits |
|
5,085 |
|
3,527 |
||
| Bridge notes payable |
|
- |
|
- |
||
| Warrants liability |
|
- |
|
138,102 |
||
| Lease liabilities |
|
15,831 |
|
1,912 |
||
| Convertible notes |
|
659,129 |
||||
| Total non-current liabilities |
|
680,045 |
|
143,541 |
||
| Total liabilities |
|
757,408 |
|
156,763 |
||
| Temporary equity |
|
- |
|
- |
||
| Stockholder's equity (deficit) |
|
905,036 |
|
907,130 |
||
| Total liabilities and equity | $ |
1,662,444 |
$ |
1,063,893 |
||
Fisker Inc. and Subsidiaries Unaudited Condensed Consolidated Statements of Cash Flows (amounts in thousands, except share and per share data) |
||||||
Three Months Ended June 30, |
||||||
2021 |
2020 |
|||||
| Cash flows from Operating Activities | ||||||
| Net loss | $ (109,844 |
) |
$ (39,663 |
) |
||
| Stock-based comp | 1,043 |
|
264 |
|
||
| Depreciation and Amortization | 164 |
|
14 |
|
||
| Accretion of debt issuance costs | 153 |
|
640 |
|
||
| Change in fair value of embedded derivative | - |
|
29,149 |
|
||
| Change in operating assets and liabilities | 5,838 |
|
(761 |
) |
||
| Other operating activities | (804 |
) |
3,555 |
|
||
| Net cash used in operating activities | (103,450 |
) |
(6,802 |
) |
||
| Cash flows from Investing Activities | ||||||
| Purchase of property and equipment | (15,838 |
) |
(224 |
) |
||
| Net cash used in investing activities | (15,838 |
) |
(224 |
) |
||
| Cash flows from Financing Activities | ||||||
| Proceeds from issuance of bridge notes | - |
|
2,488 |
|
||
| Proceeds from convertible notes / equity security | 667,500 |
|
46,500 |
|
||
| Payments for debt issuance costs | (8,523 |
) |
- |
|
||
| Payments for capped call option | (96,788 |
) |
- |
|
||
| Payments of deferred offering costs | - |
|
(671 |
) |
||
| Proceeds from exercise of stock options | 35 |
|
60 |
|
||
| Payments to tax authorities for statutory tax withholdings | (4,891 |
) |
- |
|
||
| Net cash provided by financing activities | 557,333 |
|
48,377 |
|
||
| Net increase / (decrease) in cash and cash equivalents | 438,045 |
|
41,351 |
|
||
| Cash and cash equivalents, beginning of period | 962,366 |
|
3,625 |
|
||
| Cash and cash equivalents, end of period | $ 1,400,411 |
|
$ 44,976 |
|
||
GAAP Loss from Operations to Non-GAAP Adjusted Loss from Operations (Unaudited, amounts in thousands, except share and per share data) |
||||||||||||
| Three Months Ended | ||||||||||||
| September 30, 2021 | June 30, 2021 | September 30, 2020 | ||||||||||
| GAAP Loss from operations | $ |
(109,565 |
) |
$ |
(53,140 |
) |
|
(9,923 |
) |
|||
| Add: stock-based compensation |
|
1,043 |
|
|
2,218 |
|
|
264 |
|
|||
| Non-GAAP Adjusted loss from operations | $ |
(108,522 |
) |
$ |
(50,922 |
) |
$ |
(9,659 |
) |
|||
View source version on businesswire.com: https://www.businesswire.com/news/home/20211103006141/en/
Contacts
Fisker Inc.
Dan Galves, VP, Investor Relations
investors@fiskerinc.com
Simon Sproule, SVP, Communications
310.374.6177
Fisker@GoDRIVEN360.com


