Retail department store chain Macy’s Inc. (NYSE: M) stock spiked on its Q4 2022 earnings beat and subsequent guidance raise for full-year 2023. The headline numbers were impressive. Retailers have suffered from normalization and margin compression amidst a pullback in consumer discretionary spending. High inflation, rising interest rates, and macroeconomic uncertainty are all headwinds that impact consumers.
Even retailers that beat on the top line saw EPS shrink and vice versa. The post-pandemic reopening was a one-time bonanza for retailers as pent-up demand combined with stimulus checks drove consumer discretionary spending through the roof.
Back to Reality
Those good times vaporized in 2022 as normalization kicked back in. Margin compression, high inventory levels, and declining consumer demand are all headwinds being suffered by retailers, as echoed by Nordstrom Inc. (NYSE: JWN), Kohl’s Corp (NYSE: KSS), and Ross Stores Inc. (NASDAQ: ROST). Did Macy's perform the unthinkable and buck the margin compression and normalization trend?
A Miracle, Fluke, or Façade?
Not quite. The impressive earnings beat was partly due to the extensive guide down in Q2 2022. The company still saw a (245 bps) drop in gross margins to 34.1%. This is down from 40.6% in Q2 2021. Most of the financial metrics are on a YoY decline.
Its brick-and-mortar business fell below 2019 pre-pandemic levels, down (11%), when there was significant concern over the death of foot traffic in malls and standalone stores. Sales continue to trend negatively, as do margins and profits. Its metrics are returning towards and under 2019 pre-pandemic levels.
Behind the Headlines
On Aug 23, 2022, Macy’s released its fourth-quarter fiscal 2022 results for the quarter ending December 2022. The company reported adjusted diluted earnings-per-share (EPS) of $1.88, excluding non-recurring items, versus consensus analyst estimates for a profit of $1.59, a $0.29 per share beat. Adjust diluted EPS decreased from $2.45 in the year-ago period to $2.12 in Q4 2019 pre-pandemic.
Revenues fell (-4.6%) year-over-year (YoY) to $8.26 billion, missing consensus analyst estimates for $8.27 billion. Net sales fell (0.9%) versus 2019. Brick-and-mortar sales fell (2%) YoY and (11%) versus Q4 2019, but 80 Macy's stores have closed since then. Comparable same-store sales (SSS) fell (-3.3%) YoY. Inventory levels fell (3%) YoY and (18%) versus 2019.
Gross margins fell (245 bps) to 34.1%, down from 36.5% in Q4 2021, down from 38.9% in Q2 2021, and down from 40.6% in Q2 2021. Do you see the trend? This has been the trend in retail due to markdowns and promotions (margin compression) in response to competitors doing the same thing.
CEO Pats Himself on the Back
Macy’s CEO Jeff Gennette commented, "We successfully navigated 2022 from a financial and operational strength position. Despite an increasingly volatile macroeconomic climate, through the ongoing execution of our Polaris strategy, we remained agile, pivoted to meet customer demand, and elevated our approach to inventory management.”
Setting the Bar Low Enough to Skip Over
On its Q2 2022 earnings release, Macy’s lowered its full-year 2022 sales and EPS forecasts to $4.00 to $4.20 from $4.53 to $4.95. The full-year 2022 adjusted diluted EPS came in at $4.48, crushing its lowered guidance of $4.00 to $4.20. It still pales in comparison to the full-year 2021 EPS of $5.31.
Raising the Bar, Kind Of
Macy’s raised its full-year 2023 guidance with EPS of $3.67 to $4.11 versus $3.84 consensus analyst estimates on revenues of $23.7 to $24.2 billion versus $24.43 billion analyst estimates. These are clearly below full-year 2022 and 2021 results further extending the decline from 2021 peaks. Macy's has over 700 locations for value investors, with its real estate valued between $6 billion to $8 billion alone. Its market cap is $5.3 billion, which means the business is accessible and can collateralize or sell pieces of its real estate portfolio to raise cash or pay down its $5.9 billion in long-term debt.
Ascending Triangle Breakdown
M appears to be breaking down. The weekly candlestick chart has an ascending triangle pattern comprised of a flat top and rising lows. Eventually, the stock should break out through the flat top trendline or below the diagonal rising lows trendline. The weekly ascending triangle commenced after bottoming at $14.99 in September 2022. Shares triggered the weekly market structure low (MSL) breakout through $17.73 to double top near $23.89, forming the flat upper trendline.
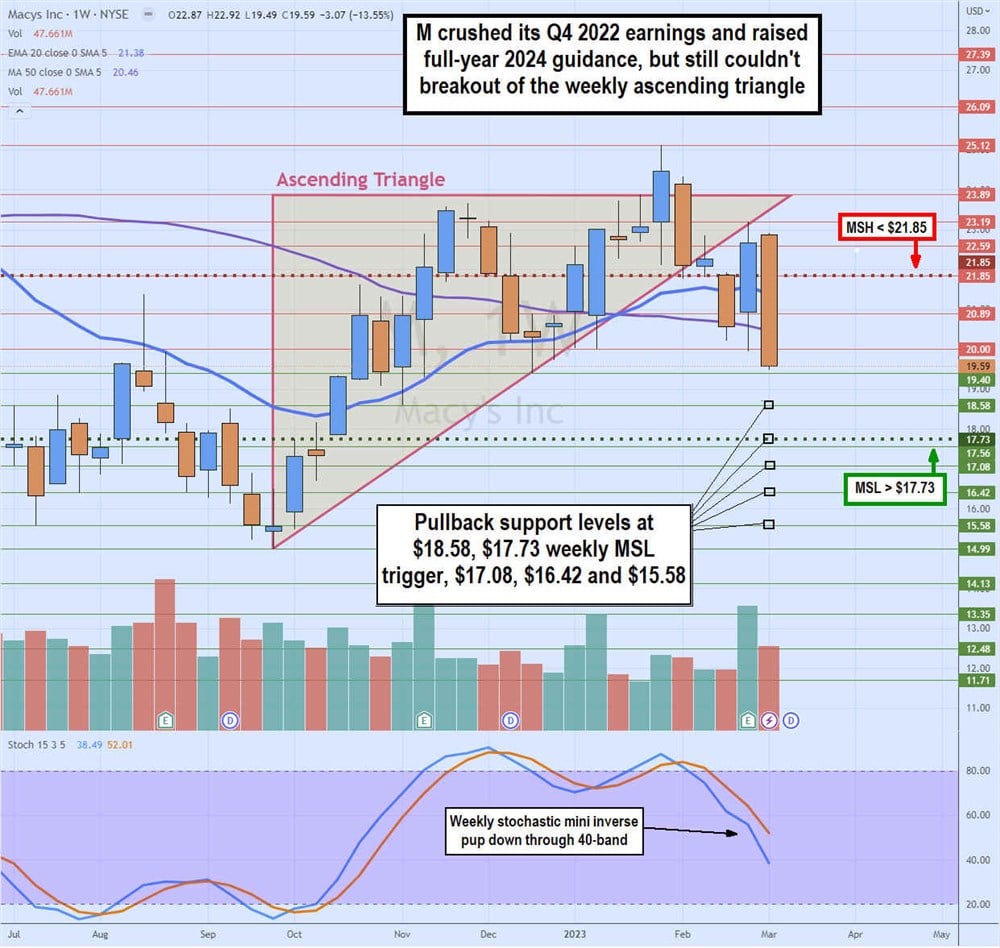
Its Q4 2022 earnings initially gapped the stock back towards rising trendline resistance at $23.19 but sold off on a significant bearish engulfing pattern the following week. M attempted to breakout for a single green weekly candle at the end of January 2023 but collapsed afterward.
The weekly stochastic has a mini inverse pup, and shares fell through its 50-period moving average (MA) support at $20.46. Pullback support levels are at $18.58, $17.73 weekly MSL trigger, $17.08, $16.42, and $15.58.