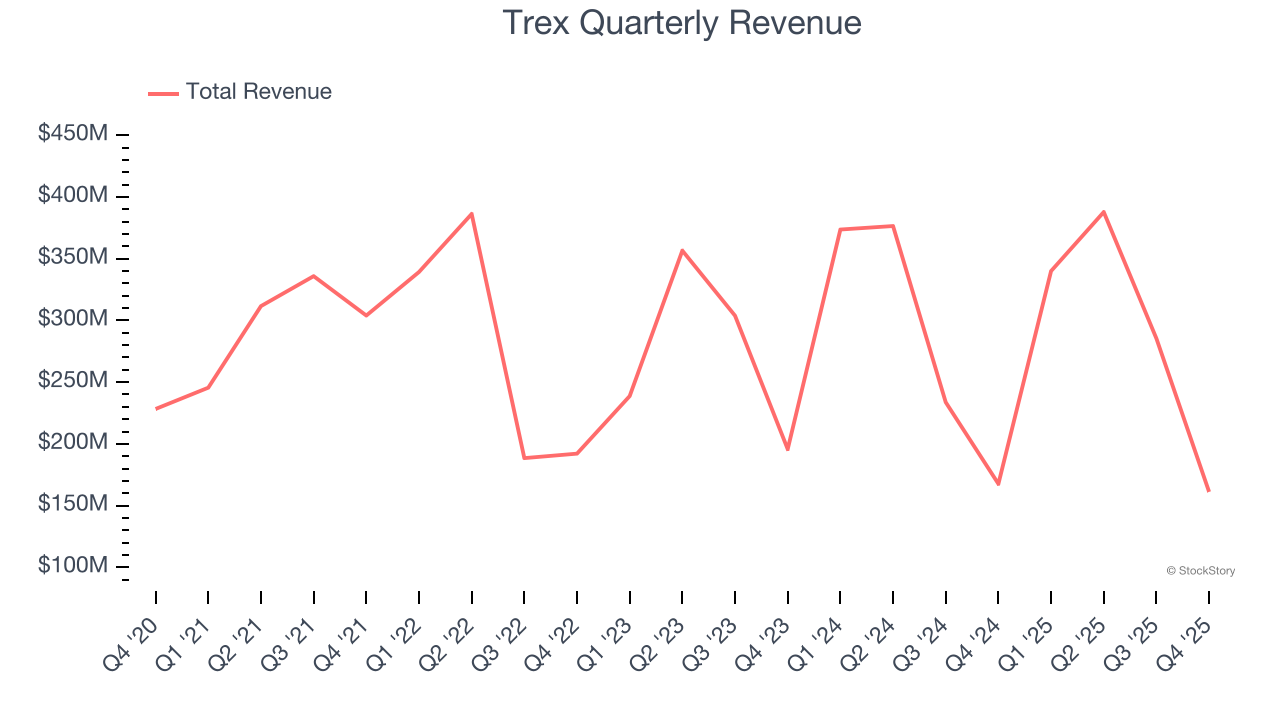
Composite decking and railing products manufacturer Trex Company (NYSE: TREX) beat Wall Street’s revenue expectations in Q4 CY2025, but sales fell by 3.9% year on year to $161.1 million. The company’s full-year revenue guidance of $1.21 billion at the midpoint came in 0.6% above analysts’ estimates. Its non-GAAP profit of $0.04 per share was significantly above analysts’ consensus estimates.
Is now the time to buy Trex? Find out by accessing our full research report, it’s free.
Trex (TREX) Q4 CY2025 Highlights:
- Revenue: $161.1 million vs analyst estimates of $144.7 million (3.9% year-on-year decline, 11.3% beat)
- Adjusted EPS: $0.04 vs analyst estimates of -$0.01 (significant beat)
- Adjusted EBITDA: $22.32 million vs analyst estimates of $15.02 million (13.9% margin, 48.6% beat)
- EBITDA guidance for the upcoming financial year 2026 is $327.5 million at the midpoint, above analyst estimates of $314.7 million
- Operating Margin: 2.2%, down from 9.2% in the same quarter last year
- Free Cash Flow was $22.11 million, up from -$89.33 million in the same quarter last year
- Market Capitalization: $4.32 billion
Company Overview
Addressing the demand for aesthetically-pleasing and unique outdoor living spaces, Trex Company (NYSE: TREX) makes wood-alternative decking, railing, and patio furniture.
Revenue Growth
A company’s long-term sales performance can indicate its overall quality. Any business can have short-term success, but a top-tier one grows for years. Over the last five years, Trex grew its sales at a tepid 5.9% compounded annual growth rate. This fell short of our benchmark for the industrials sector and is a rough starting point for our analysis.
Long-term growth is the most important, but within industrials, a half-decade historical view may miss new industry trends or demand cycles. Trex’s recent performance shows its demand has slowed as its annualized revenue growth of 3.6% over the last two years was below its five-year trend. We’re wary when companies in the sector see decelerations in revenue growth, as it could signal changing consumer tastes aided by low switching costs. 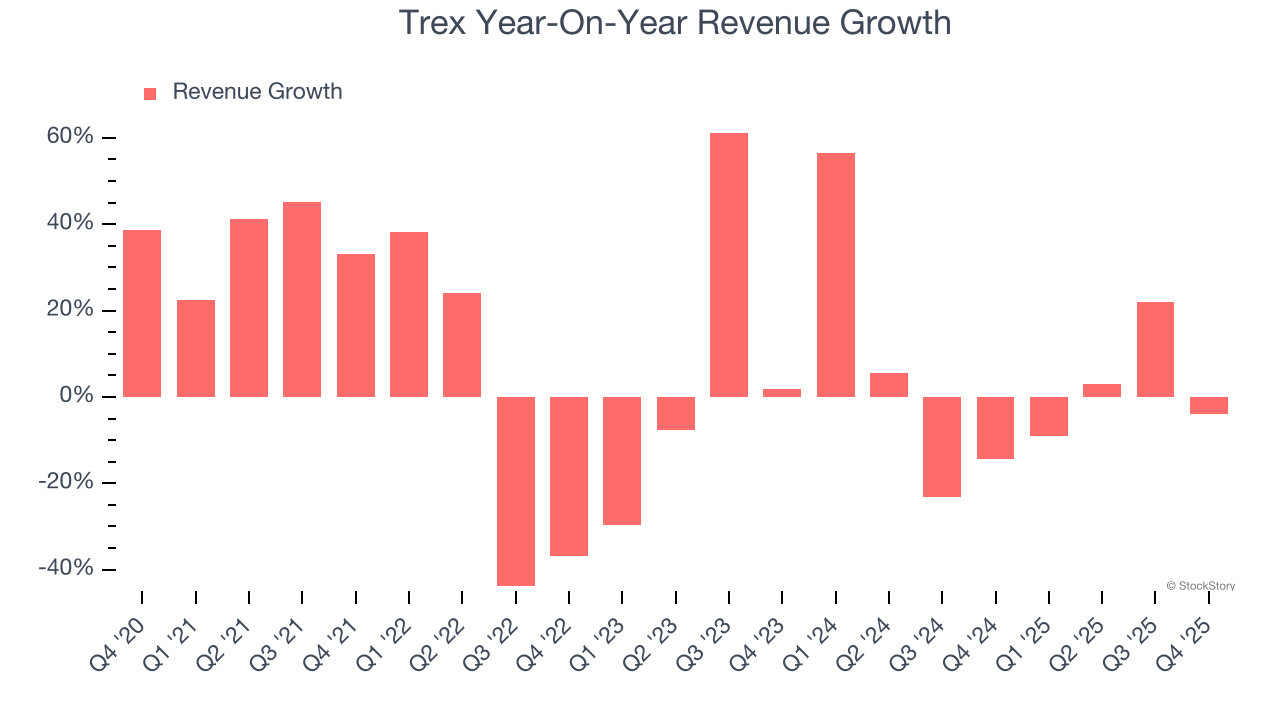
This quarter, Trex’s revenue fell by 3.9% year on year to $161.1 million but beat Wall Street’s estimates by 11.3%.
Looking ahead, sell-side analysts expect revenue to grow 2.3% over the next 12 months, similar to its two-year rate. This projection doesn't excite us and implies its products and services will see some demand headwinds.
The 1999 book Gorilla Game predicted Microsoft and Apple would dominate tech before it happened. Its thesis? Identify the platform winners early. Today, enterprise software companies embedding generative AI are becoming the new gorillas. a profitable, fast-growing enterprise software stock that is already riding the automation wave and looking to catch the generative AI next.
Operating Margin
Operating margin is one of the best measures of profitability because it tells us how much money a company takes home after procuring and manufacturing its products, marketing and selling those products, and most importantly, keeping them relevant through research and development.
Trex has been a well-oiled machine over the last five years. It demonstrated elite profitability for an industrials business, boasting an average operating margin of 24.7%. This result isn’t surprising as its high gross margin gives it a favorable starting point.
Analyzing the trend in its profitability, Trex’s operating margin decreased by 5.3 percentage points over the last five years. This raises questions about the company’s expense base because its revenue growth should have given it leverage on its fixed costs, resulting in better economies of scale and profitability.
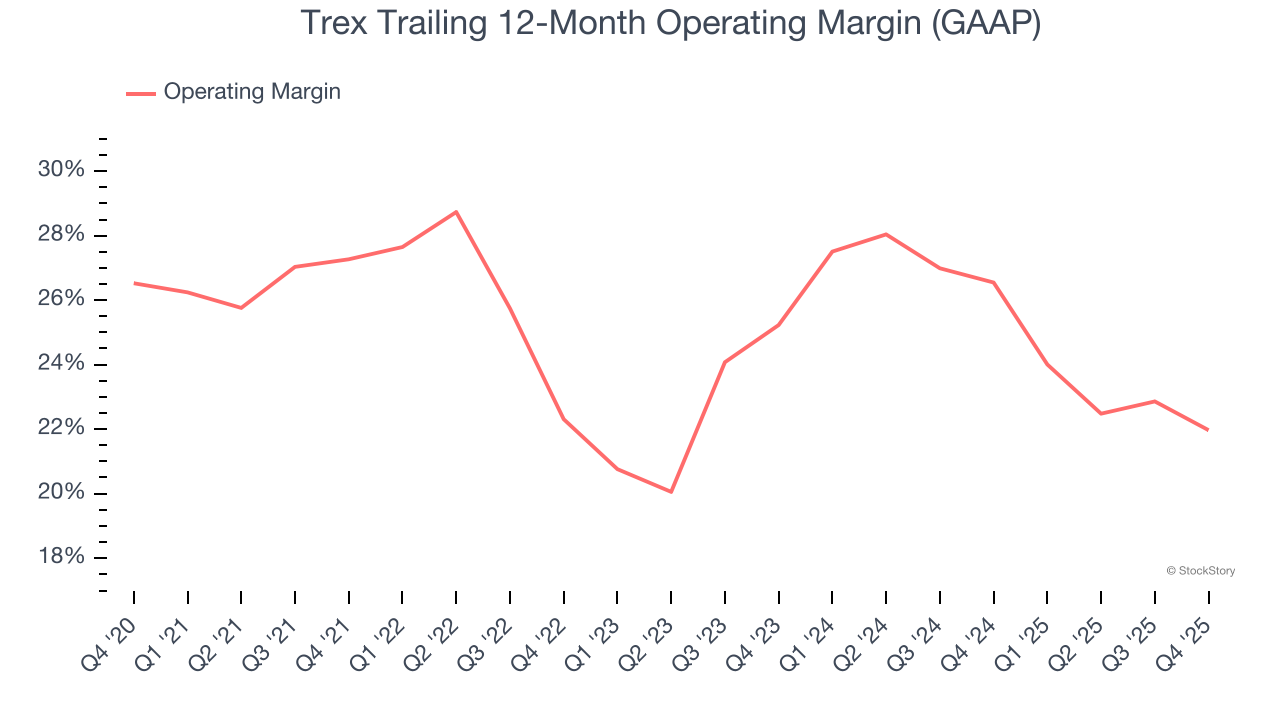
This quarter, Trex generated an operating margin profit margin of 2.2%, down 7 percentage points year on year. Since Trex’s operating margin decreased more than its gross margin, we can assume it was less efficient because expenses such as marketing, R&D, and administrative overhead increased.
Earnings Per Share
We track the long-term change in earnings per share (EPS) for the same reason as long-term revenue growth. Compared to revenue, however, EPS highlights whether a company’s growth is profitable.
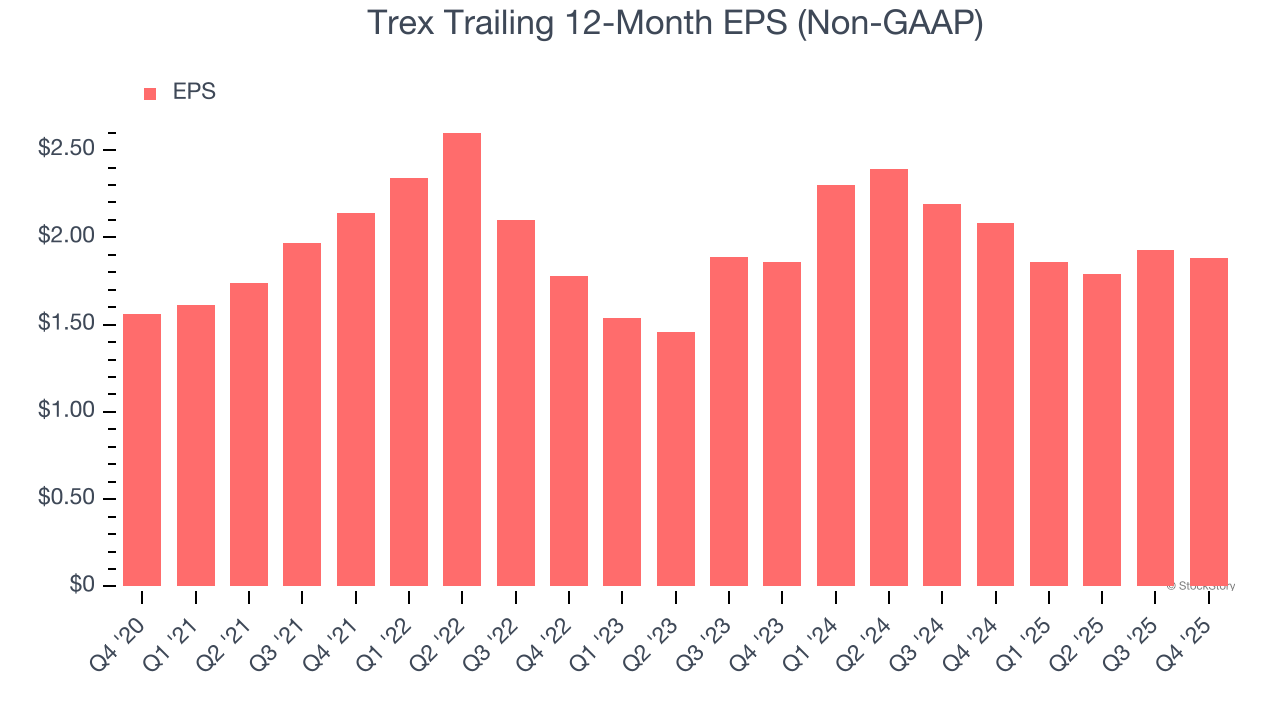
Trex’s EPS grew at a weak 3.8% compounded annual growth rate over the last five years, lower than its 5.9% annualized revenue growth. This tells us the company became less profitable on a per-share basis as it expanded due to non-fundamental factors such as interest expenses and taxes.
Diving into the nuances of Trex’s earnings can give us a better understanding of its performance. As we mentioned earlier, Trex’s operating margin declined by 5.3 percentage points over the last five years. This was the most relevant factor (aside from the revenue impact) behind its lower earnings; interest expenses and taxes can also affect EPS but don’t tell us as much about a company’s fundamentals.
Like with revenue, we analyze EPS over a shorter period to see if we are missing a change in the business.
For Trex, EPS didn’t budge over the last two years, a regression from its five-year trend. We hope it can revert to earnings growth in the coming years.
In Q4, Trex reported adjusted EPS of $0.04, down from $0.09 in the same quarter last year. Despite falling year on year, this print easily cleared analysts’ estimates. Over the next 12 months, Wall Street expects Trex’s full-year EPS of $1.88 to shrink by 13.1%.
Key Takeaways from Trex’s Q4 Results
It was good to see Trex beat analysts’ EPS expectations this quarter. We were also excited its EBITDA outperformed Wall Street’s estimates by a wide margin. Zooming out, we think this was a good print with some key areas of upside. The stock traded up 4.3% to $43.25 immediately following the results.
Indeed, Trex had a rock-solid quarterly earnings result, but is this stock a good investment here? The latest quarter does matter, but not nearly as much as longer-term fundamentals and valuation, when deciding if the stock is a buy. We cover that in our actionable full research report which you can read here (it’s free).