


Communication platform operator Zoom Video Communications, Inc. (ZM) reported robust second-quarter results and raised its full-year outlook this week. The company also aims to enhance productivity through Artificial Intelligence (AI).
For the second quarter (ended July 31), ZM’s revenue increased 3.6% year-over-year to $1.14 billion, while its non-GAAP net income and non-GAAP net income per share came in at $409.57 million and $1.34, up 26.6% and 27.6% from the prior-year quarter, respectively.
The company also raised its full-year (fiscal 2024) outlook. ZM expects its total revenue to be between $4.485 billion and $4.495 billion, up from the prior forecast of $4.465 billion-$4.485 billion.
Given this backdrop, let’s look at the trends of ZM’s key financial metrics to understand why it could be wise to invest in the stock now.
Analyzing Zoom Video Communications' PE Ratio, Revenue, and Other Key Financial Metrics (2020-2023)
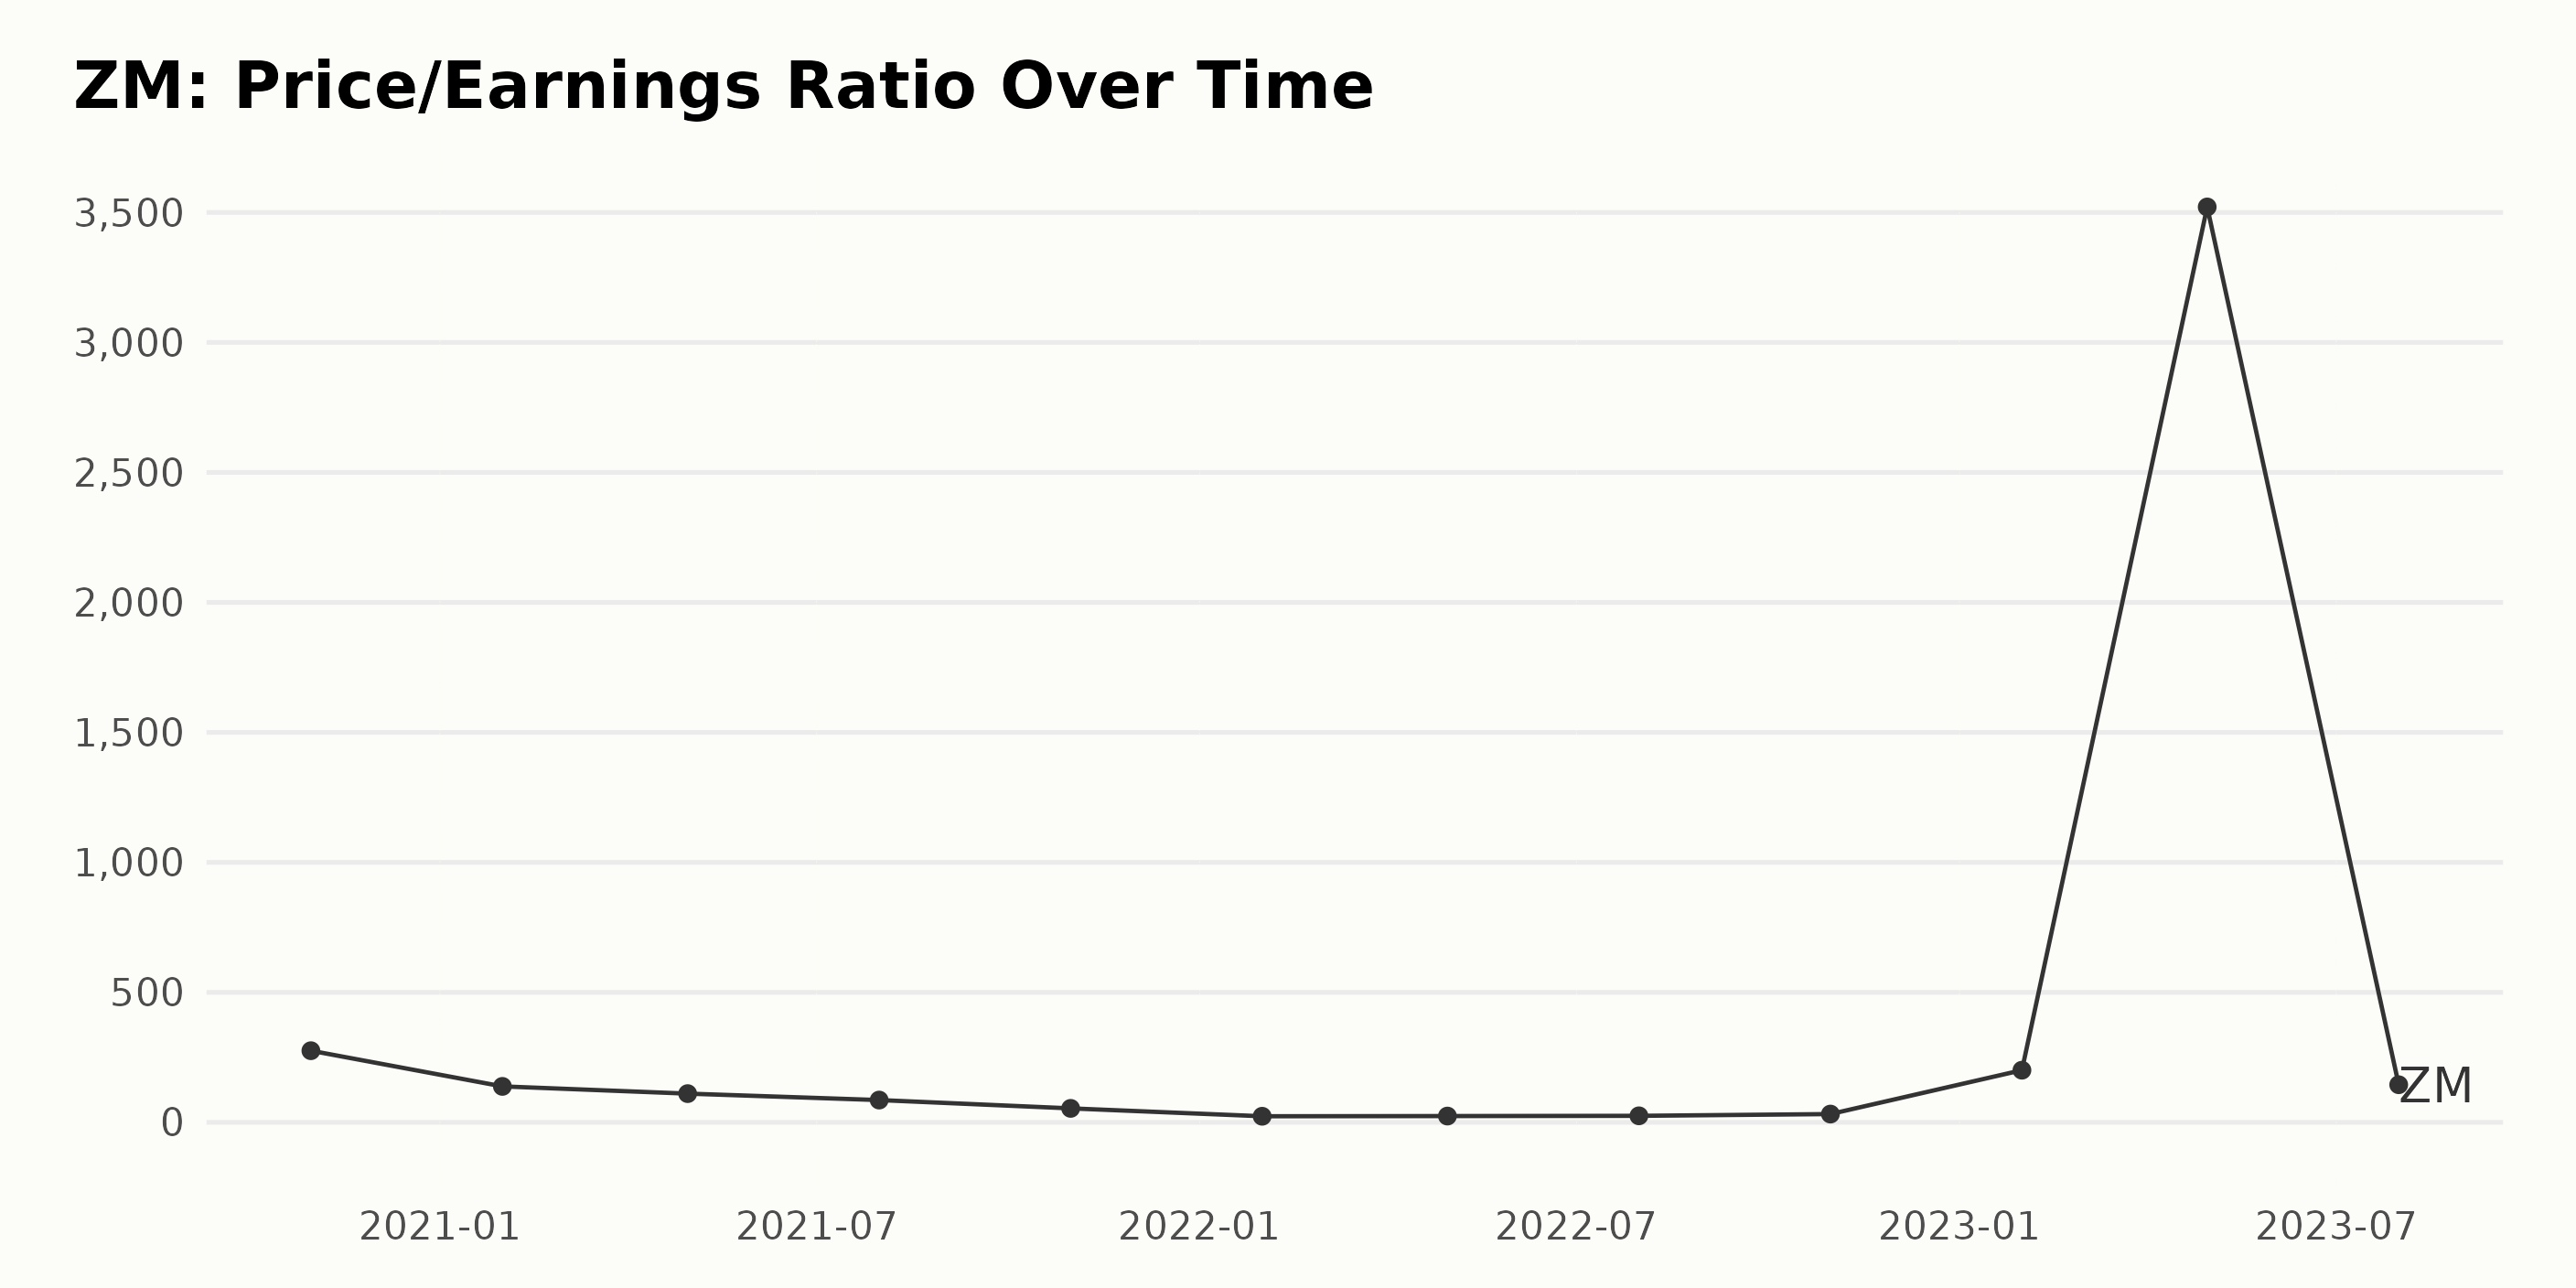
ZM's Price/Earnings Ratio (P/E) demonstrated notable trend shifts and fluctuations from October 2020 to July 2023.
- In October 2020, the P/E ratio stood at 275.60 and began a sustained downward trend.
- By January 2021, it had fallen by half to 138.35. It continued to fall further, reaching 53.78 in October 2021.
- An all-time low of 23.47 was noted in January 2022.
- However, ZM's P/E pattern changed course starting in April 2022 as the numbers gradually increased.
- The P/E bottomed out at 23.47 in January 2022 but showed an upward trend afterward, reaching 31.88 by October 2022.
- A significant spike was observed in 2023, reaching a record high of 3,521.01 in April 2023. This represents an enormous increase compared with the preceding data points.
- The period ended with a noted decrease to 144.76 in July 2023.
The overall growth rate of the PE ratio from October 2020 to July 2023 was measured at -47.4% when comparing the first value (275.60) with the last value (144.76). However, this figure masks the dramatic fluctuation and spike in April 2023. More importantly, significant emphasis ought to be placed on the latest data showing a peak of 3521.01 in April 2023, which then dropped significantly to 144.76 three months later in July 2023.
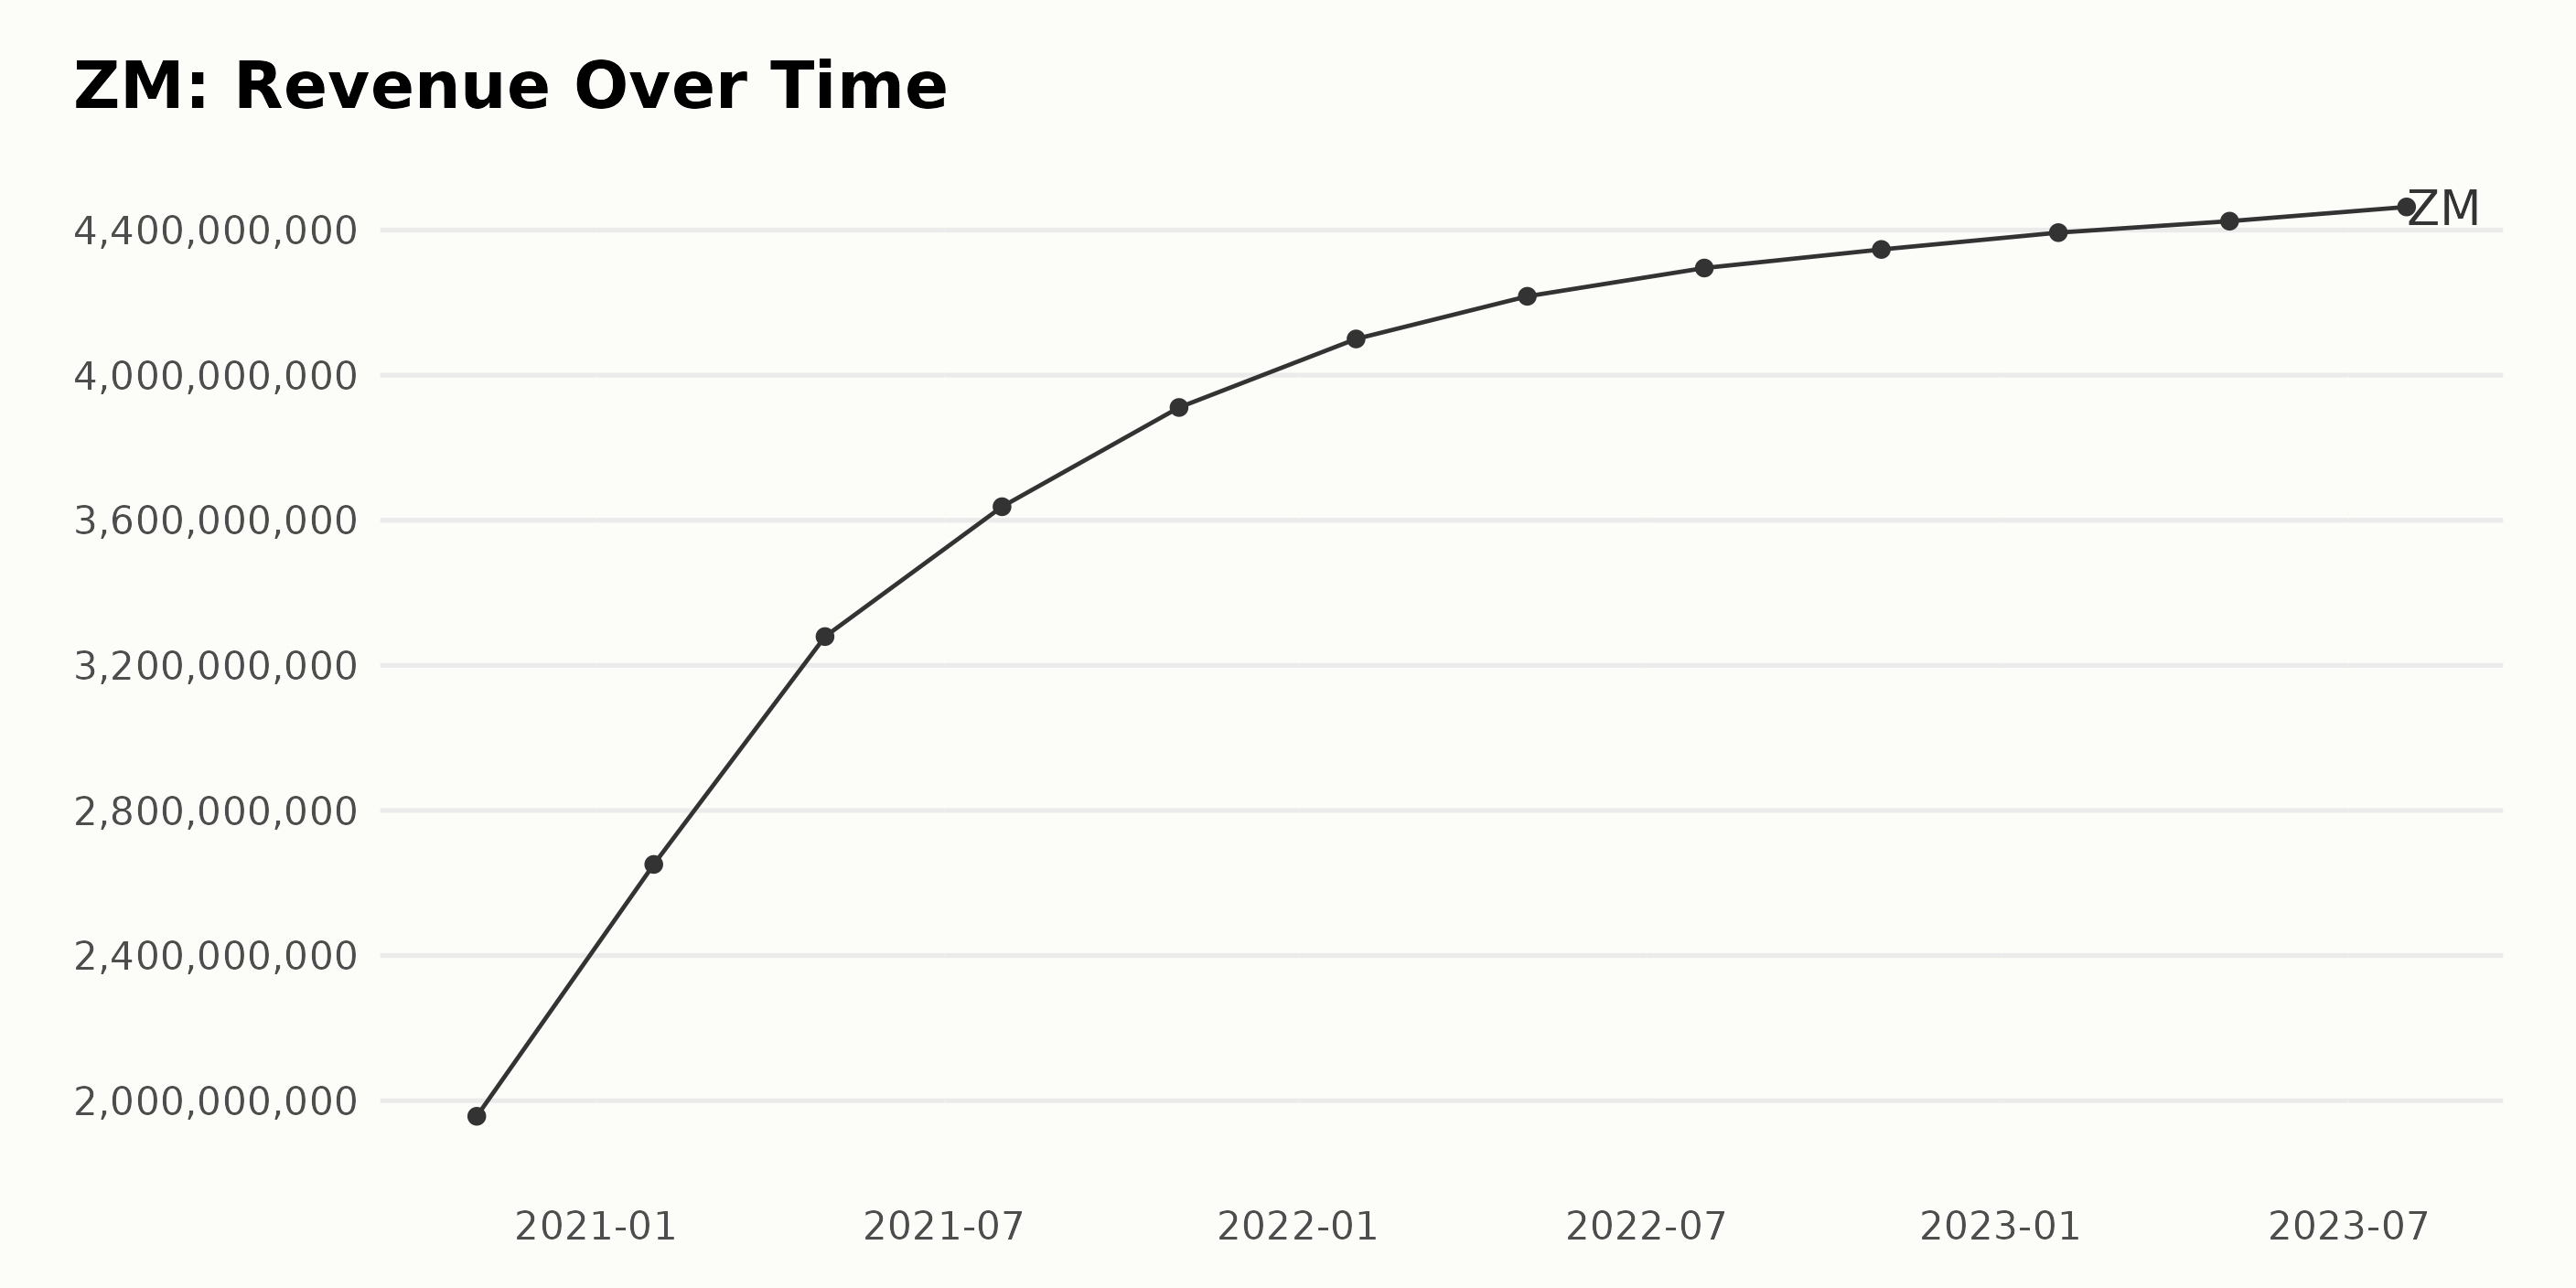
The trailing-12-month revenue trend for ZM shows consistent growth over the period from October 2020 to July 2023. The revenue has been growing from $1.96 billion in October 2020 to $4.46 billion in July 2023, representing an approximately 128% increase during this period. Yearly Overview:
- In 2020: There was a significant increase in the revenue from $1.96 billion in October to $2.65 billion in January 2021, indicating a growth rate of about 35% over three months.
- In 2021: Starting from $2.65 billion in January, the revenue grew consistently to reach $3.91 billion by October, marking around a 47% increase in the year.
- In 2022: The revenue increased slightly slower this year, starting at $4.10 billion in January and reaching $4.35 billion by October, reflecting a growth of just above 6%.
- In 2023: The increase slowed down noticeably, with the revenue reaching from $4.39 billion in January to $4.46 billion by July, growing at a pace of approximately 1.6% over six months.
In summary, despite some variability of the growth rate across years, ZM indicated a stable and positive financial performance, ending with a revenue of $4.46 billion as of July 2023, which is about 128% higher than the initial value in October 2020.
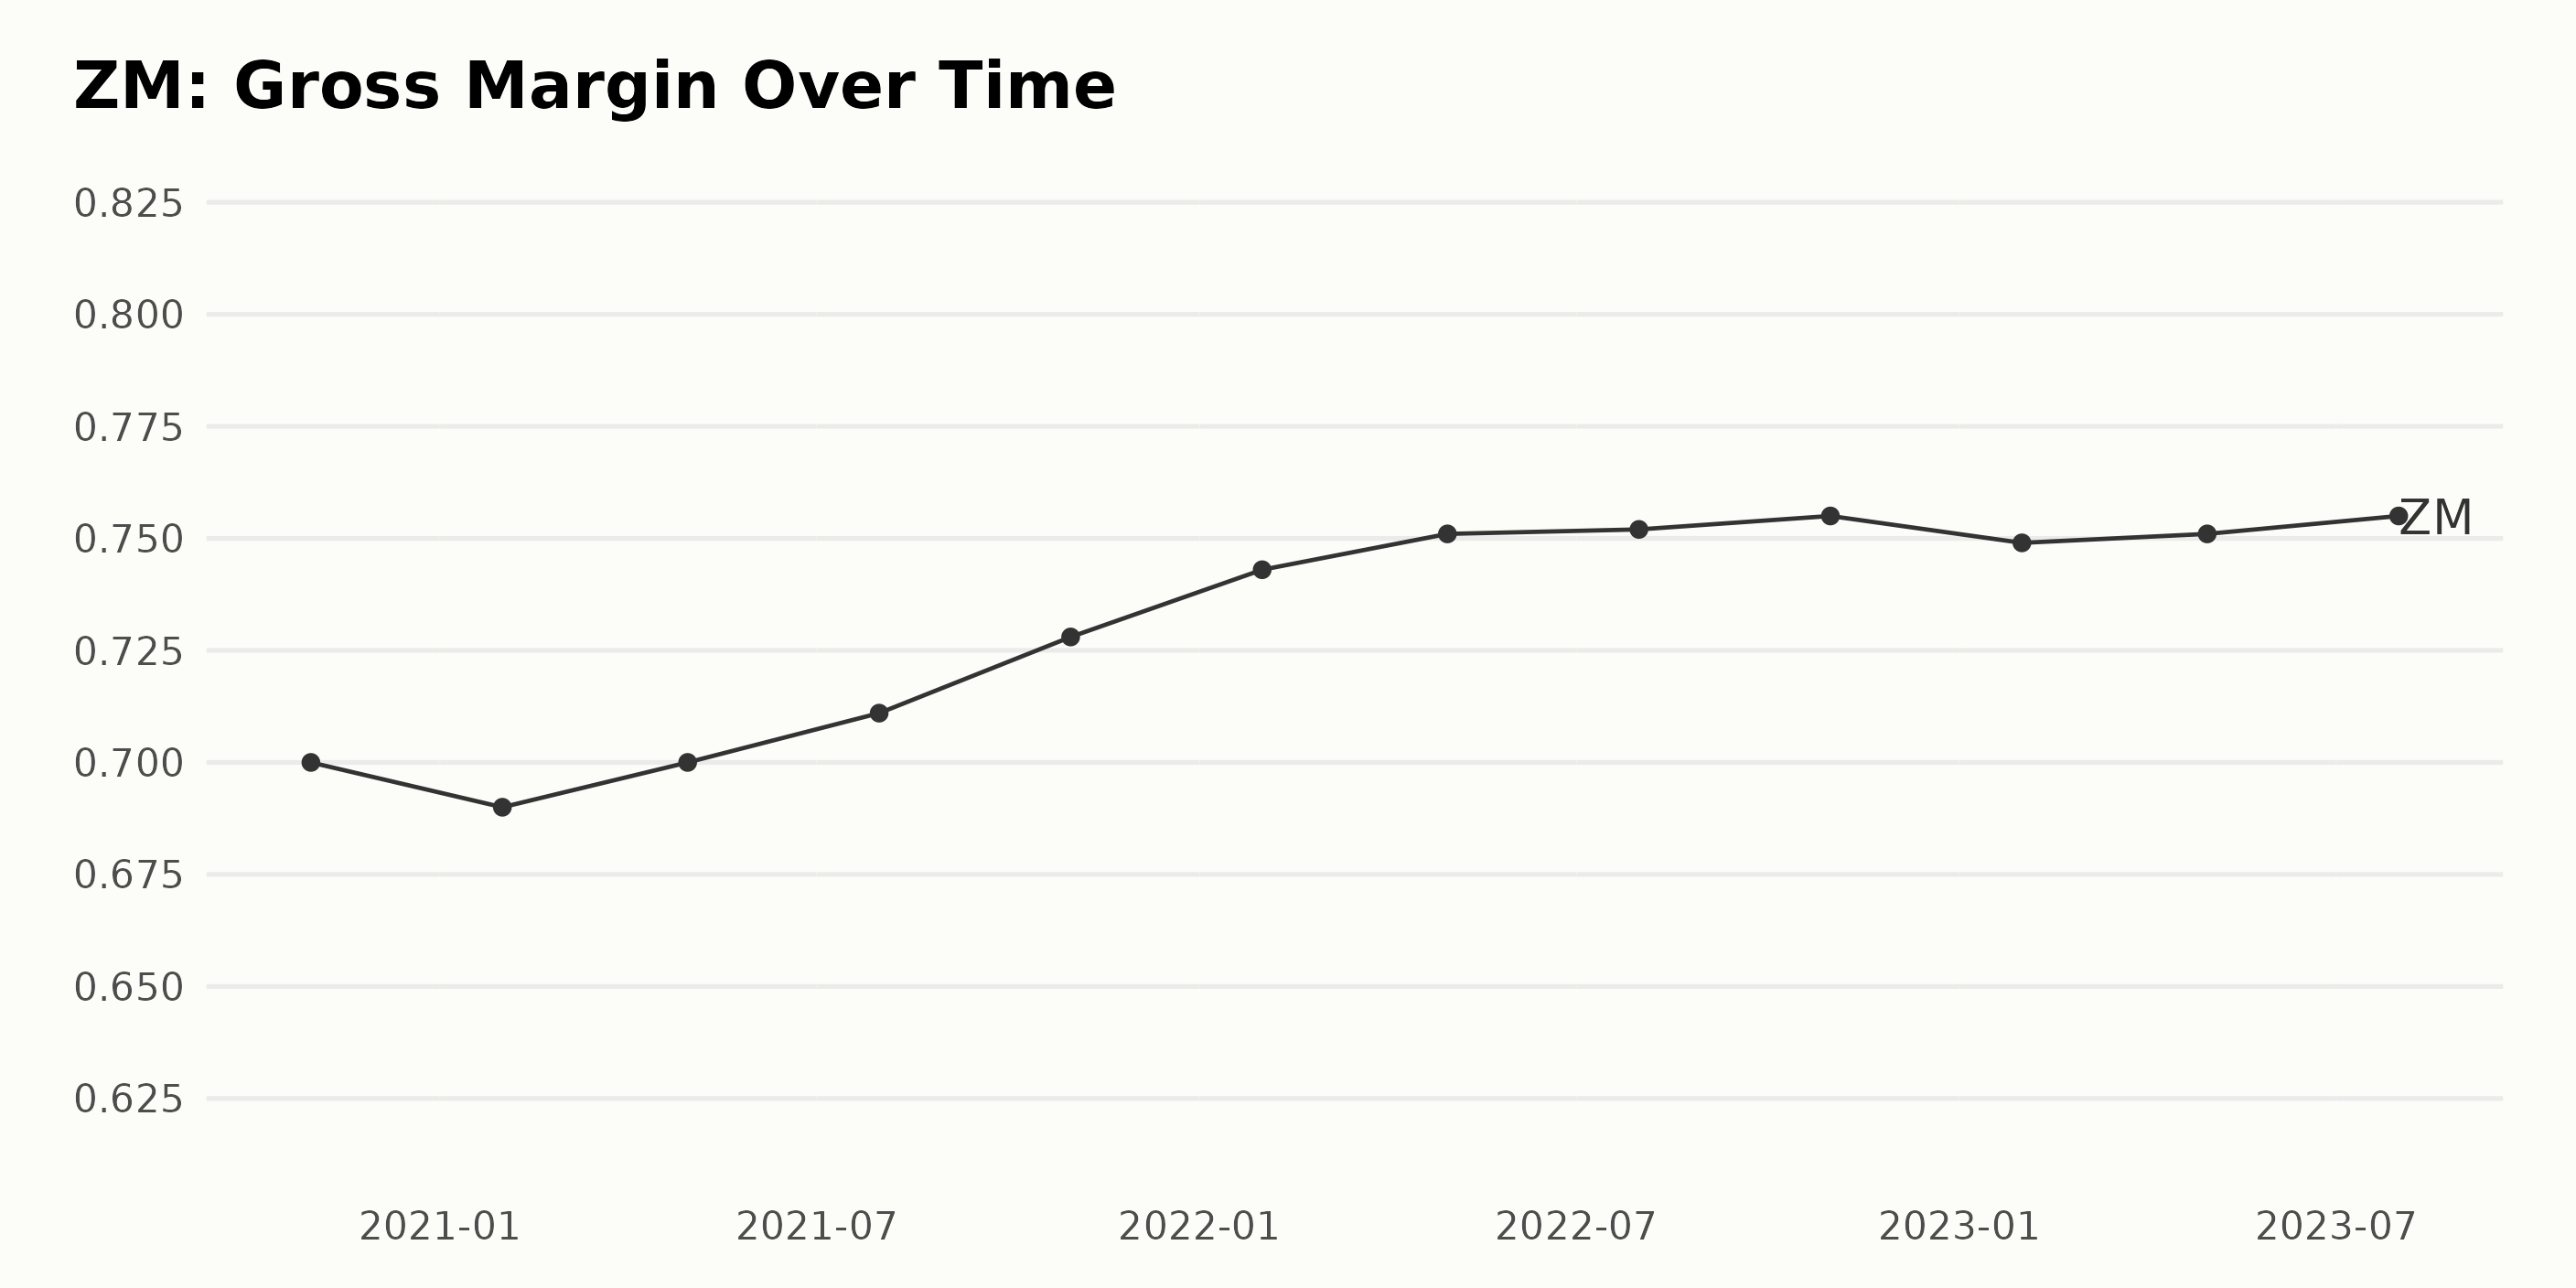
The gross margin trend for ZM has shown noticeable fluctuations between October 2020 and July 2023:
- October 2020 - Gross margin starts at 70%.
- January 2021 - A slight dip occurred to 69%.
- April 2021 - The gross margin returns to the beginning value of 70%.
- July 2021 - An incremental increase shows with a gross margin of 71.1%.
- October 2021 - The value rises again to 72.8%.
- January 2022 - Another increase sets the margin at 74.3%.
- April 2022 - The rate continues to increase, peaking at 75.1%.
- July 2022 - The trend slightly plateaus with a margin of 75.2%.
- October 2022 - Another subtle rise occurs with a gross margin of 75.5%.
- January 2023 - A dip occurs, bringing it to 74.9%.
- April 2023 - A slight recovery happens, with the margin returning to 75.1%.
- July 2023 - The series ends with a rise as the gross margin peaks at 75.5%.
Notably, the growth rate from October 2020 (70%) to July 2023 (75.5%) indicates a 7.86% overall increase across the observed period. The data suggests that despite short-lived dips in ZM’s gross margin, the general trend is on an upward trajectory, with the most recent months showing a consistent gross margin above 75%.
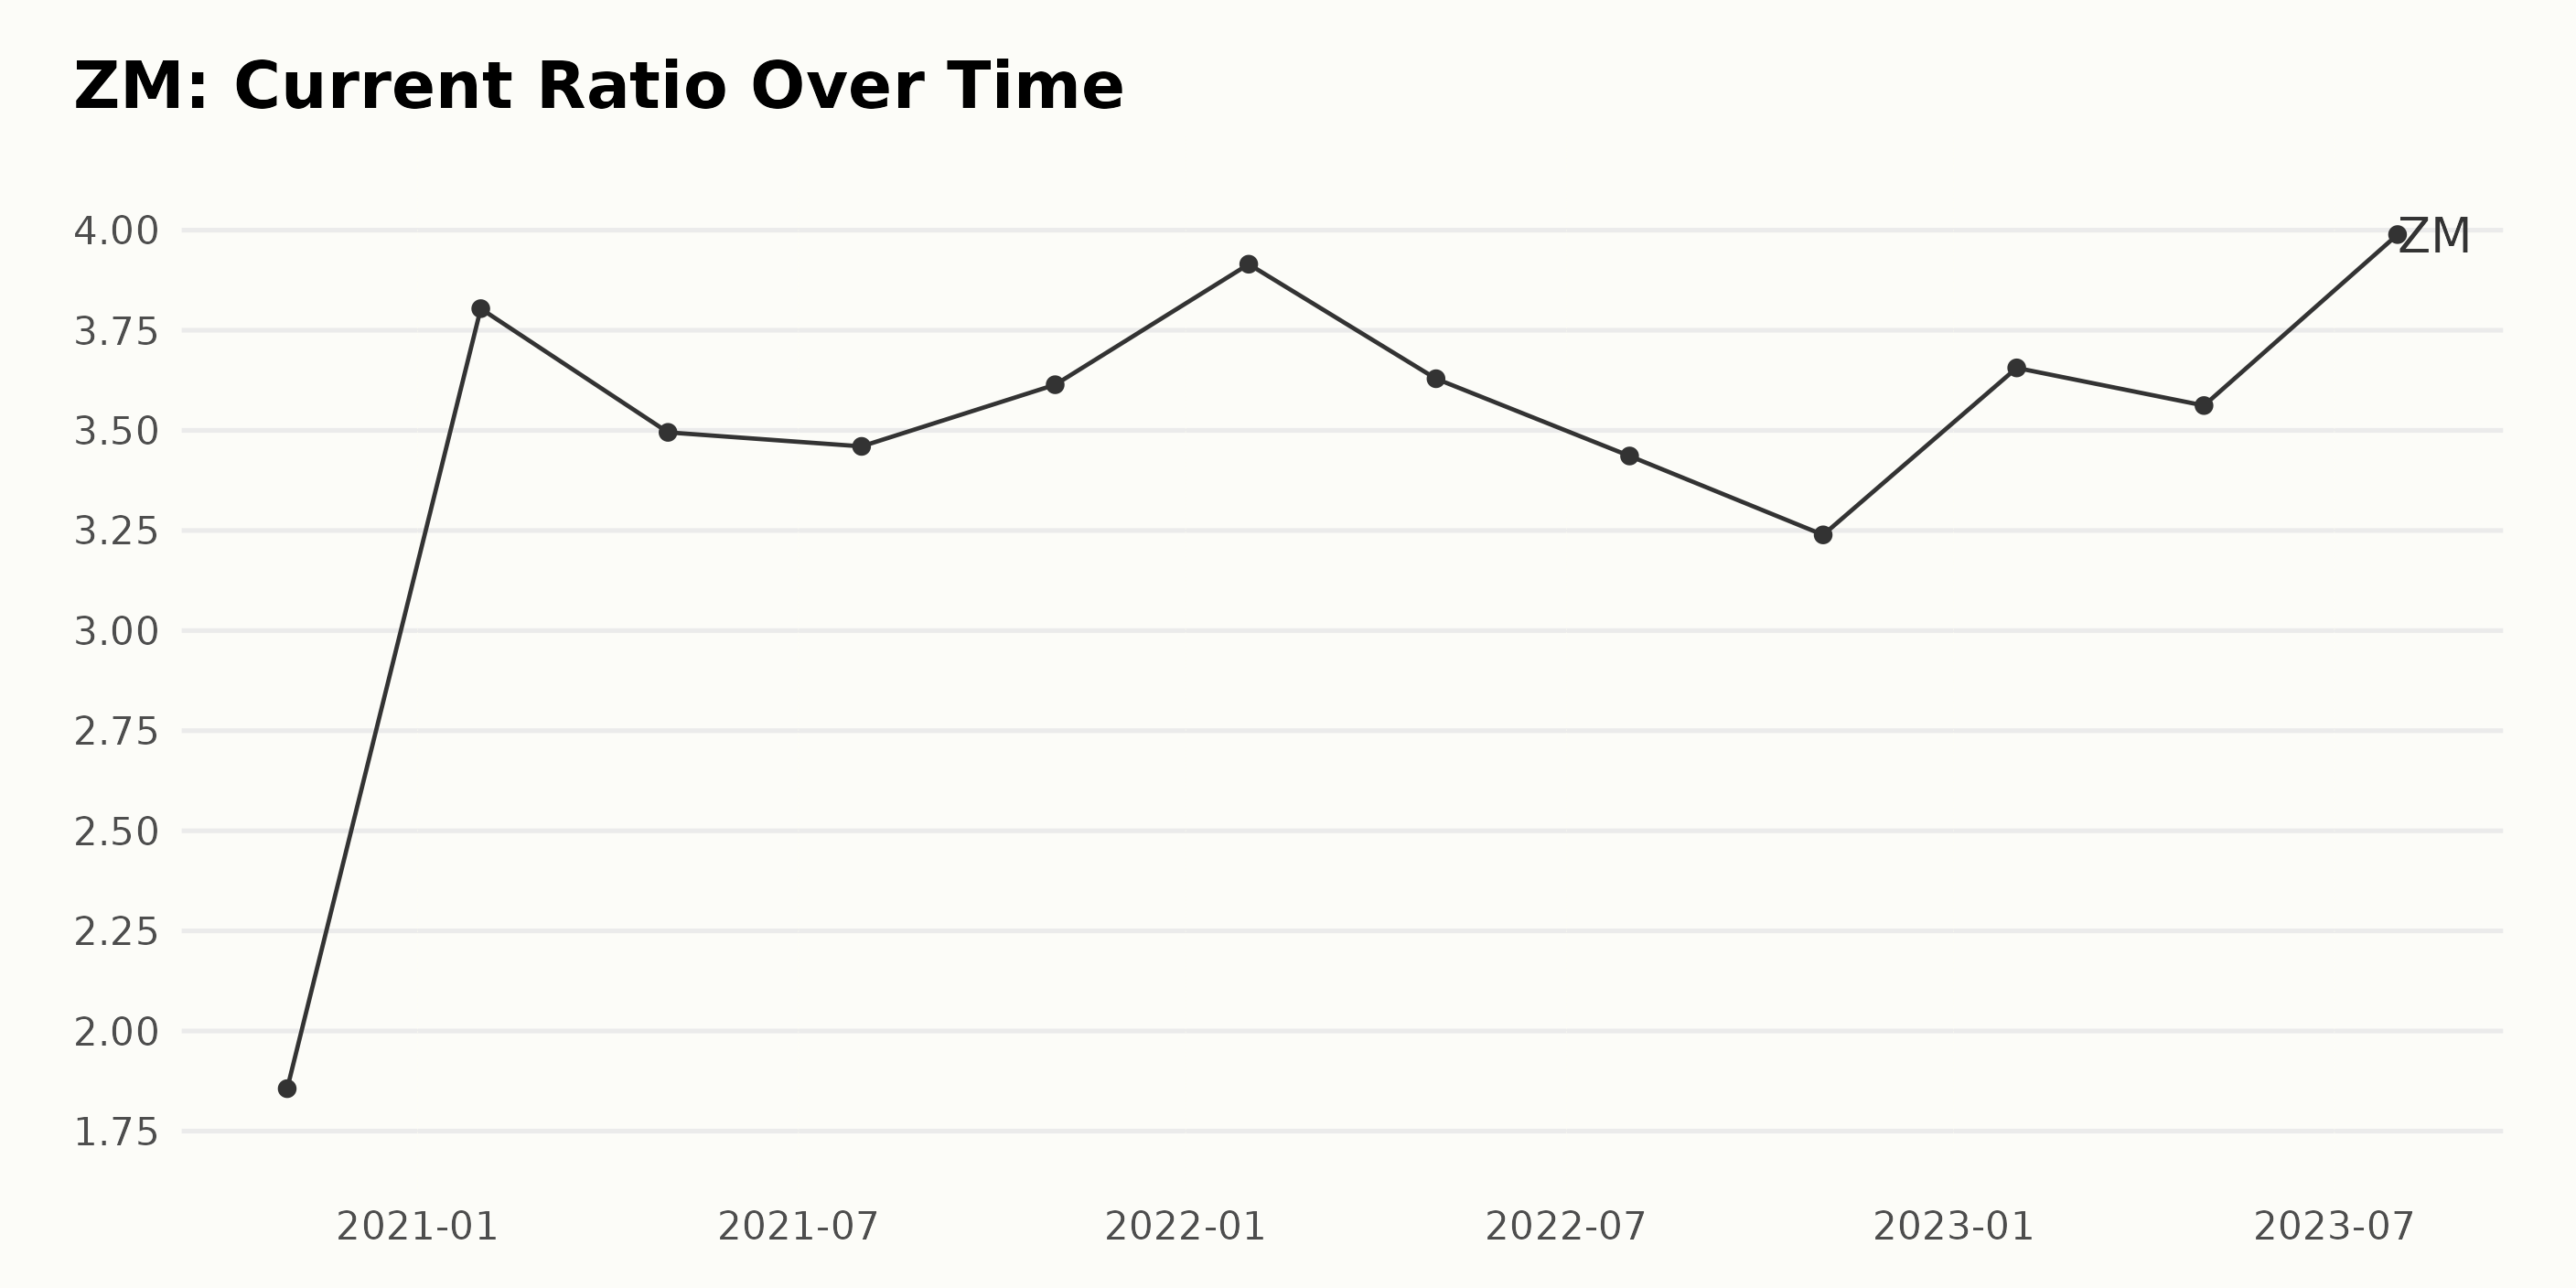
The data represents the trends and fluctuations in the current ratio of ZM over a period of almost three years. Here are the significant points:
- In October 2020, the current ratio stood at 1.86.
- Noticeable growth was observed in January 2021, when the ratio almost doubled to 3.80.
- From April 2021 to October 2022, fluctuations were seen as the ratio hovered around mid-3s, with a slight downward trend culminating at 3.24 in October 2022.
- From January 2023 to July 2023, an increasing trend was evident, with the ratio reaching its highest at 3.99 in July 2023. This is significantly greater than the starting value from October 2020, indicating a general upward trend.
Reflecting a growth rate of approximately 115% from October 2020 to July 2023. Although minor fluctuations occurred, the overall trend for the current ratio of ZM has been on the rise in the stated period.
The most recent data from July 2023 suggests robust financial health, as a higher current ratio indicates that the company can pay off its short-term obligations more comfortably.
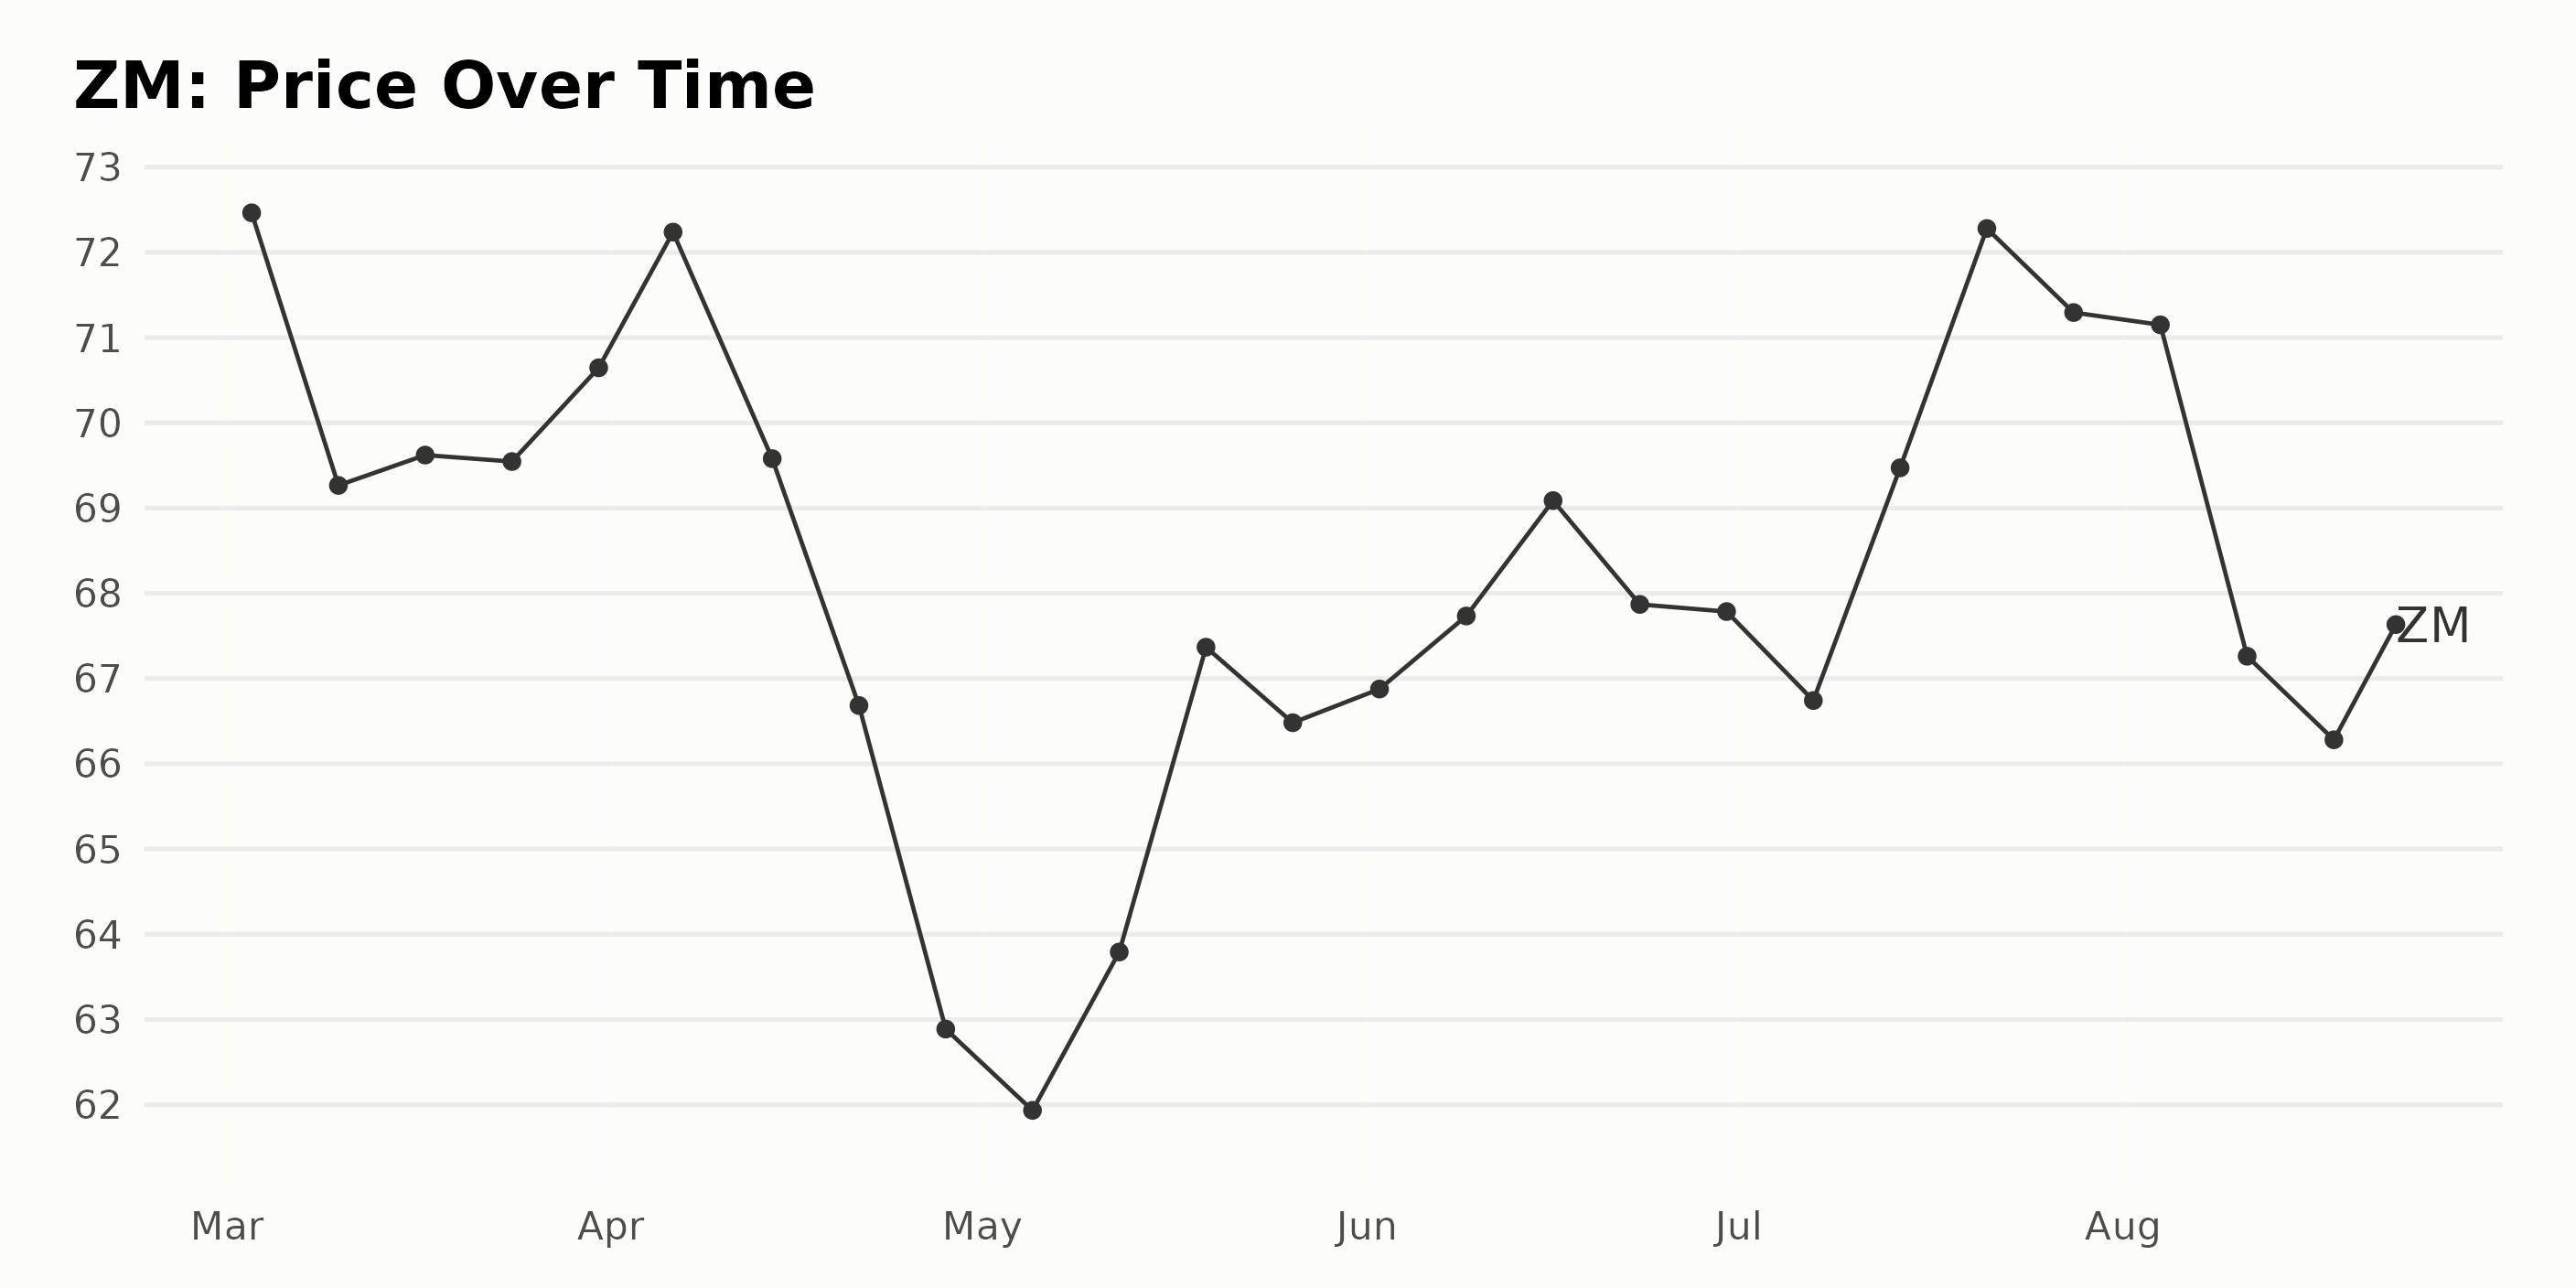
Fluctuating Trend in Zoom's Share Prices: A Six-Month Analysis (March-August 2023)
The share prices of ZM from March 2023 to August 2023 show a fluctuating trend. Here are the details:
- On March 3, 2023, the ZM shares were priced at $72.46. Over the course of that month, the share price decreased, finishing at $70.65 by March 31.
- In April, the price initially rose to $72.24 but then dropped significantly to $62.89 before rebounding slightly to $66.68.
- During May, there was a general growth in the share prices, starting at $61.93 and closing at $66.48.
- June saw relatively stable prices around the $67-$69 range, with little variance throughout the month.
- In July, however, a significant increase happened. The month started with the share price at $66.74 and ended high at $71.29 after a peak of $72.28 on July 21, 2023.
- In August, the prices showed a deceleration, with prices dropping to $66.28 midway through the month, followed by a slight rebound back to $68.17 by August 23.
In summary, ZM share prices have a clear fluctuating trend from March to August 2023. The overall growth rate is not consistent, showing periods of increases and decreases throughout this time. Here is a chart of ZM's price over the past 180 days.
Analyzing Zoom Video Communications' Performance: Quality, Value, and Growth Ratings
ZM, which falls under the Technology - Services category containing a total of 76 stocks, holds the latest POWR Ratings grade of B (Buy). The data details its progression through the ranking system:
- Starting from a C (Neutral) grade and rank of #33 within its category during the week of February 25, 2023.
- By March 4, 2023, it improved to a B (Buy) grade and significantly advanced to rank #26 in its class. ZM maintained this position throughout March 2023.
- Throughout April 2023, the grade remained B (Buy), but the rank improved gradually, reaching rank #21 at the end of the month.
- In May 2023, the rank fluctuated between #24 and #18 but kept a constant B (Buy) grade.
- The month of June 2023 showed a slight improvement, with ZM oscillating between ranks #16 and #22.
- Throughout July 2023 and leading into August 2023, ZM maintained a steady B (Buy) grade and ranked between #17 and #20 within its category.
- As of August 24, 2023, ZM achieved its highest standing so far, having reached rank #9 within the Technology - Services category while still maintaining its B (Buy) grade.
Based on the provided data, the three most noteworthy dimensions for ZM are Quality, Value, and Growth, as they have consistently high ratings.
Quality:
- In February 2023, the Quality rating was 92.
- This rating decreased slightly to 83 in March 2023, maintained until June 2023, and then increased to reach 85 from July 2023 onwards.
Value:
- The Value rating of ZM started at 83 in February 2023.
- Except for minor fluctuations, this rating has effectively hovered around 82-84 from February 2023 through August 2023.
Growth:
- The Growth dimension showed a steady increase over time. In February 2023, the rating was only 6.
- However, by August 2023, it had risen significantly to 75, showing a clear upward trend.
This analysis provides insights into the performance of ZM across these critical dimensions over time.

How does Zoom Video Communications, Inc. (ZM) Stack Up Against its Peers?
Other stocks in the Technology - Services sector that may be worth considering are Serco Group plc (SCGPY), NetScout Systems, Inc. (NTCT), and Teradata Corporation (TDC) - they have better POWR Ratings.
What To Do Next?
Discover 10 widely held stocks that our proprietary model shows have tremendous downside potential. Please make sure none of these “death trap” stocks are lurking in your portfolio:
ZM shares were trading at $67.92 per share on Thursday afternoon, down $0.25 (-0.37%). Year-to-date, ZM has gained 0.27%, versus a 15.78% rise in the benchmark S&P 500 index during the same period.
About the Author: Anushka Dutta

Anushka is an analyst whose interest in understanding the impact of broader economic changes on financial markets motivated her to pursue a career in investment research.
The post How Should Investors Trade Zoom Video Communications (ZM) After Earnings? appeared first on StockNews.com