


Intermarket analysis, as it is widely practiced today, is most closely associated with John Murphy, CMT. His contribution was not the discovery of relationships between markets, but the organization of those relationships into a structured analytical framework.
Prior to his work, most market participants evaluated major asset classes such as stocks, bonds, and commodities independently. Murphy’s approach emphasized that these markets are interconnected and often move in a definable sequence tied to the broader economic cycle.
Historical Foundations of Intermarket Analysis
However, the idea that financial markets exhibit lead-lag behavior predates Murphy by several decades. As early as the 1910s, the Harvard Economic Service documented recurring patterns in which bond markets tended to “turn” ahead of equities. These early observations were rooted in macroeconomic analysis, particularly the relationship between interest rates and business activity.
Murphy expanded on these concepts and presented them in a technical framework accessible to traders. His 1991 book, Intermarket Technical Analysis, synthesized macroeconomics and chart-based analysis, bridging a gap between economic theory and market application.
Understanding Murphy’s Intermarket Sequence
A central component of Murphy’s work is the recognition that asset classes tend to turn in a specific order, particularly around major cyclical inflection points.
This sequence is generally described as:
- Bonds lead: Changes in interest rate expectations are first reflected in bond prices and yields. Because bonds are closely tied to monetary policy and inflation expectations, they tend to react most quickly to shifts in economic conditions.
- Stocks follow: Equity markets typically respond after a lag. Changes in borrowing costs, discount rates, and liquidity conditions take time to influence corporate performance and investor sentiment.
- Commodities lag: Commodity markets, closely linked to inflation and real economic demand, often lag the broader economy.
Murphy did not present this sequence as a rigid set of rules, but rather as a recurring tendency shaped by the business cycle.
Lag Time and Market Behavior
An important aspect of intermarket analysis is lag time – that is, the delay between turning points in different asset classes. Murphy emphasized that while the order of movement tends to be consistent, the duration of these lags can vary depending on economic conditions, policy responses, and external shocks.
This variability is what makes intermarket analysis interpretive rather than mechanical. Traders are not simply identifying turns; they are evaluating whether relationships between markets are confirming or diverging.
Expansion Through the Business Cycle Model
Investment advisor Martin Pring's work complements Murphy’s framework by organizing intermarket relationships into a six-stage business cycle. Pring’s model tracks the progression of bonds, stocks, and commodities through expansion, overheating, tightening, and contraction phases.
Two of the more relevant stages in the context of intermarket sequencing include:
- Stage 4 (Overheating): Bond prices decline and yields rise as inflation pressures build. Stocks may continue to advance during this phase, while commodities strengthen.
- Stage 5 (Tightening): Equities begin to weaken as higher interest rates and rising input costs impact profitability. Commodities may remain elevated before eventually turning.
Pring emphasized that interest rates act as the primary catalyst, reinforcing Murphy’s view that bond market behavior is central to understanding cross-asset relationships.
What Does This Mean for Markets Now?
Recent market behavior illustrates how these relationships can be monitored in real time:
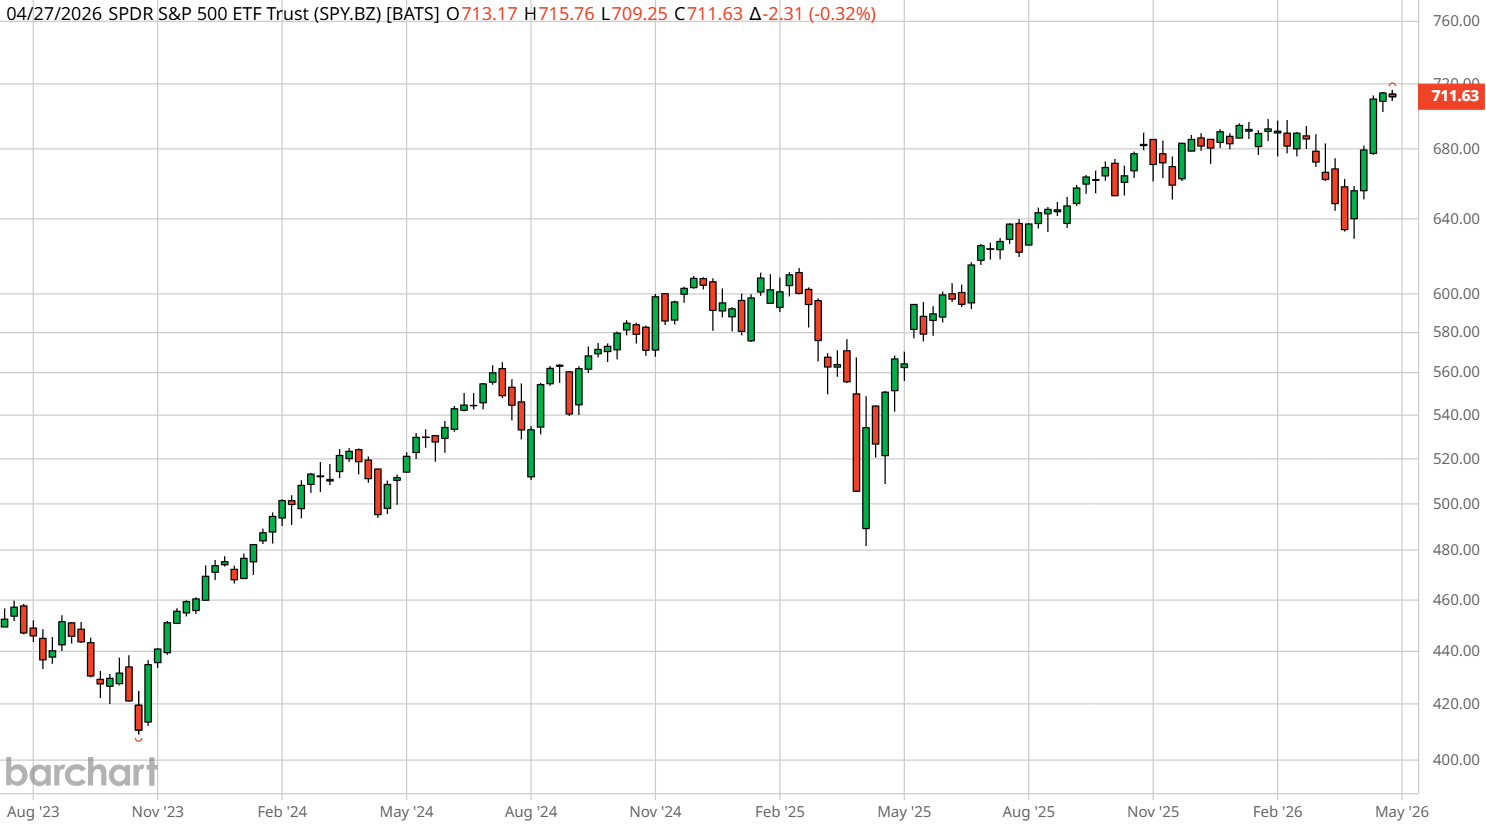
The SPDR S&P 500 ETF (SPY) has remained near recent all-time highs into late April 2026.
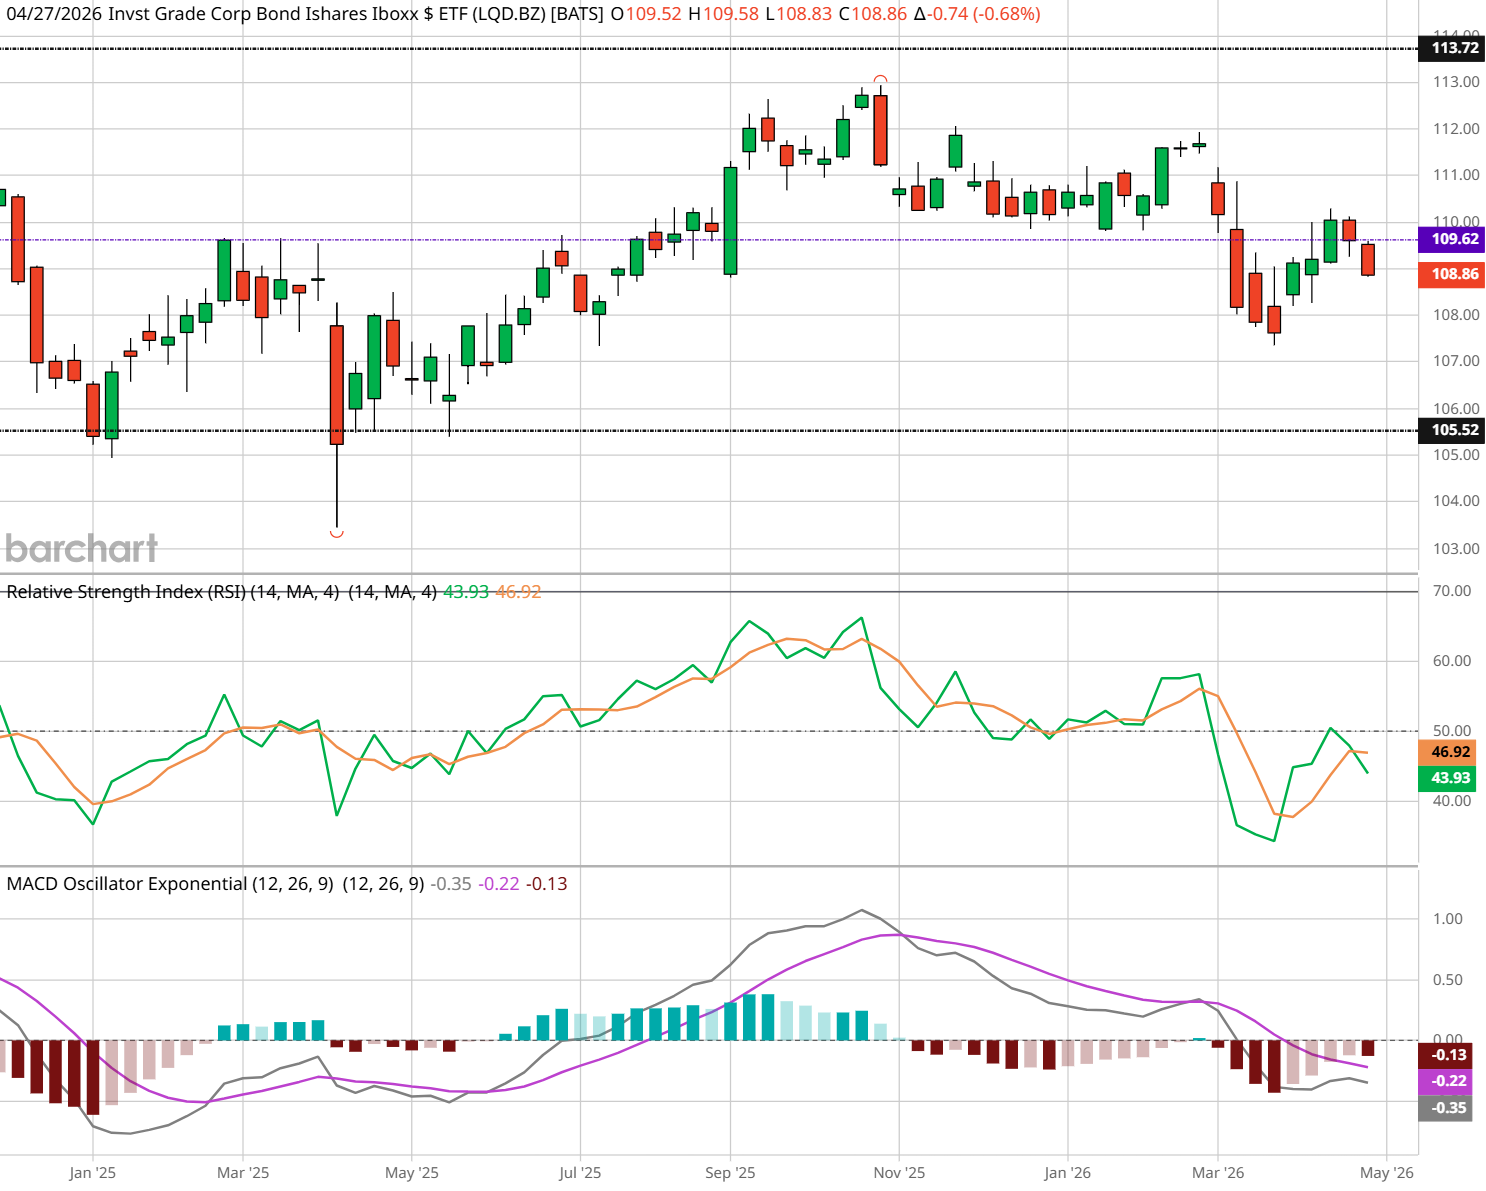
At the same time, investment-grade bond prices, as reflected by the iShares iBoxx $ Investment Grade Corporate Bond ETF (LQD), have shown signs of weakness, with yields rising from approximately 4.85% in January to above 5.20% in March.
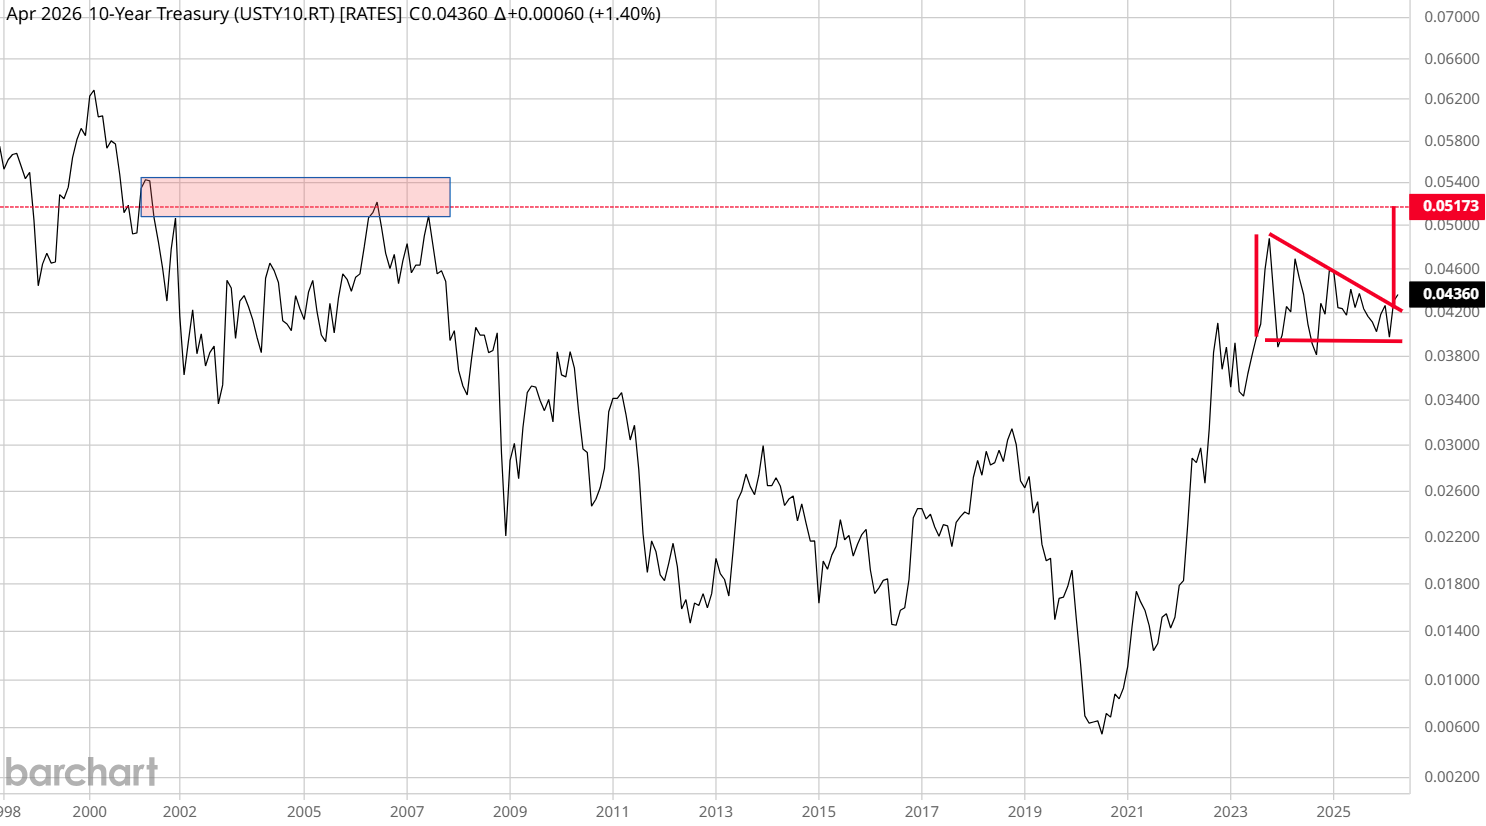
Credit spreads near 0.80% have become an important reference point, as changes in spreads often reflect shifts in perceived risk and liquidity conditions. With the 10-year yield at 4.36%, the 10-year/2-year spread is right around 0.52% as of this writing, but the charts show potential for this spread to widen.
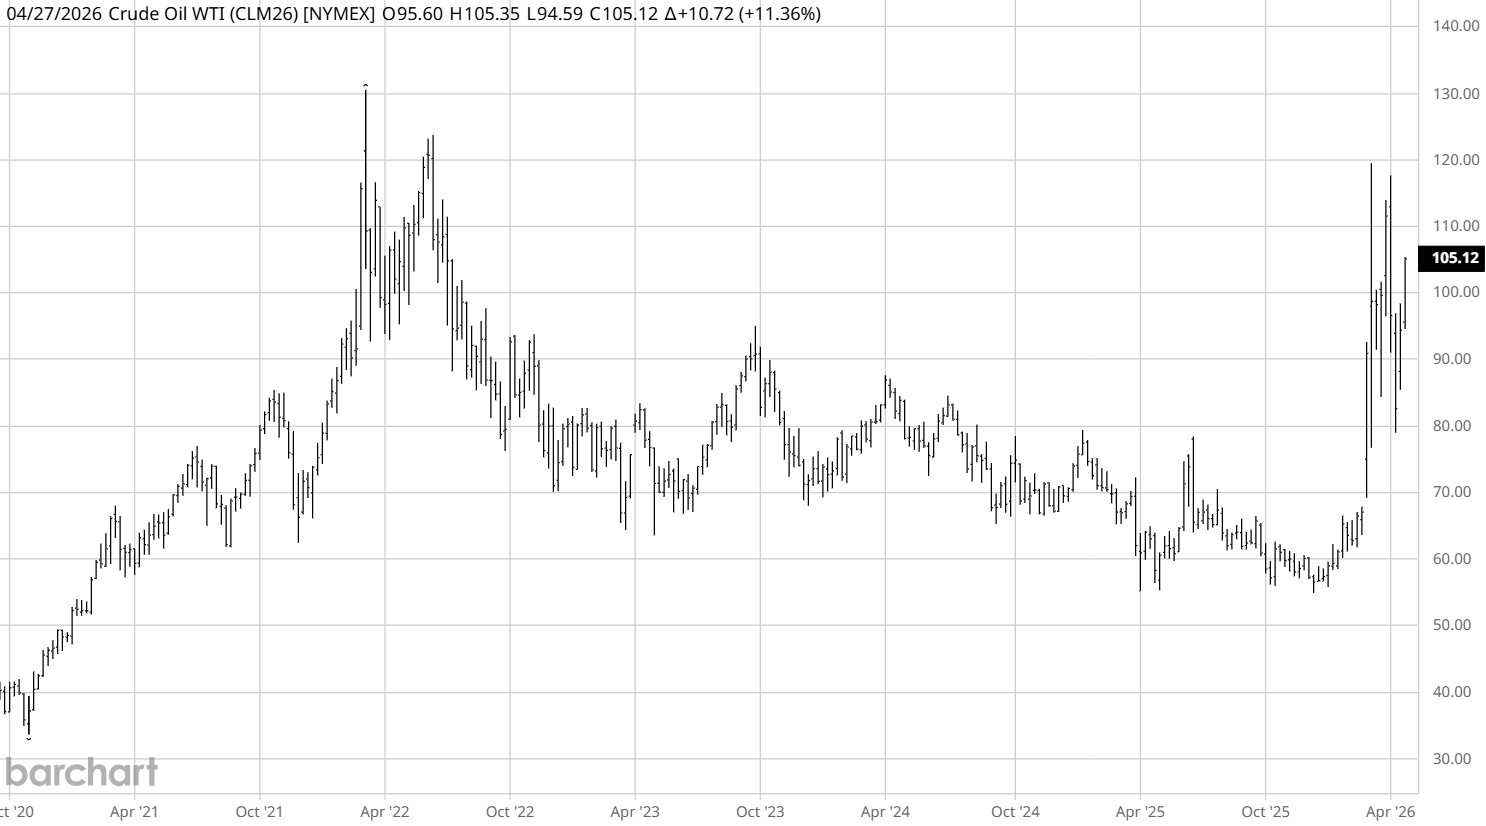
Commodity prices, particularly crude oil (CLM26), have remained elevated, reflecting ongoing inflationary pressures.
Against this backdrop, JPMorgan Chase (JPM) CEO Jamie Dimon weighed in Tuesday on the possibility of a potential crisis taking shape.
“I don’t know how the world running deficits like this isn’t inflationary,” declared Dimon, speaking at Norges Bank Investment Management conference in Oslo.
Dimon further warned that if world leaders don’t take proactive steps to address ballooning debt levels, they’ll find themselves reacting to a blowup instead: “The way it’s going now, it would be some kind of bond crisis, and then we’ll have to deal with it.”
Intermarket Analysis as a Framework
From an intermarket perspective, the analysis is less about predicting outcomes and more about identifying relationships and alignment. Periods when asset classes move in the expected sequence are often described as “confirmation,” while periods of divergence may warrant closer analysis.
Murphy’s lasting impact lies in how he reframed market analysis:
- He shifted the focus from isolated price behavior to cross-market relationships.
- He integrated macroeconomic drivers, interest rates, and inflation into technical analysis.
- He emphasized sequence and timing rather than static signals.
For traders and analysts, intermarket analysis is not a standalone system but a contextual tool. It helps answer questions such as:
- Are different asset classes reinforcing the same economic narrative?
- Is one market signaling a potential shift that hasn't yet been reflected elsewhere?
- How do changes in interest rates and inflation expectations propagate through financial markets?
As we move into the heart of this earnings season amid the continued euphoria over all things artificial intelligence (AI), crosscurrents are developing that could provide a framework for meaningful analysis – one that’s widely used not because it predicts with certainty, but because it improves situational awareness across markets.
– John Rowland, CMT, is Barchart’s Senior Market Strategist and host of Market on Close.
On the date of publication, Barchart Insights did not have (either directly or indirectly) positions in any of the securities mentioned in this article. All information and data in this article is solely for informational purposes. For more information please view the Barchart Disclosure Policy here.
More news from Barchart
- Strong Earnings and an Inflated Buffett Indicator Are Sending Opposite Signals for the Market, and for These 2 Consumer Stocks
- Is Wall Street Headed for a Bond Crisis? What Jamie Dimon, Intermarket Analysis, and 'Murphy’s Law' Are Saying Now.
- Billionaire Bill Ackman’s Pershing Square IPOs Promise to Bring Hedge Fund Results to Retail Investors, but Institutions Dominated the Offerings
- The 228% Reality Check: Why the Stock Market Is Demanding the Impossible from AI


