


Electronics manufacturing services provider Benchmark (NYSE: BHE) met Wall Street’s revenue expectations in Q1 CY2026, with sales up 7.2% year on year to $677.3 million. The company expects next quarter’s revenue to be around $720 million, coming in 5.3% above analysts’ estimates. Its non-GAAP profit of $0.58 per share was 4.8% above analysts’ consensus estimates.
Is now the time to buy Benchmark? Find out by accessing our full research report, it’s free.
Benchmark (BHE) Q1 CY2026 Highlights:
- Revenue: $677.3 million vs analyst estimates of $676.7 million (7.2% year-on-year growth, in line)
- Adjusted EPS: $0.58 vs analyst estimates of $0.55 (4.8% beat)
- Adjusted EBITDA: $39.18 million (5.8% margin, 6.6% year-on-year growth)
- Revenue Guidance for Q2 CY2026 is $720 million at the midpoint, above analyst estimates of $683.7 million
- Adjusted EPS guidance for Q2 CY2026 is $0.68 at the midpoint, above analyst estimates of $0.59
- Operating Margin: 3.2%, in line with the same quarter last year
- Free Cash Flow Margin: 4.2%, similar to the same quarter last year
- Market Capitalization: $2.47 billion
“Our first quarter results have increased our confidence in 2026 and are a clear sign of the benefits from the customer‑first initiatives we began implementing over two years ago and continue to build on today,” said David Moezidis, Benchmark’s President and CEO.
Company Overview
Operating as a critical behind-the-scenes partner for complex technology products since 1979, Benchmark Electronics (NYSE: BHE) provides advanced manufacturing, engineering, and technology solutions for original equipment manufacturers across aerospace, medical, industrial, and technology sectors.
Revenue Growth
A company’s long-term performance is an indicator of its overall quality. Even a bad business can shine for one or two quarters, but a top-tier one grows for years.
With $2.70 billion in revenue over the past 12 months, Benchmark is a mid-sized business services company, which sometimes brings disadvantages compared to larger competitors benefiting from better economies of scale. On the bright side, it can still flex high growth rates because it’s working from a smaller revenue base.
As you can see below, Benchmark’s sales grew at a decent 5.8% compounded annual growth rate over the last five years. This shows its offerings generated slightly more demand than the average business services company, a useful starting point for our analysis.
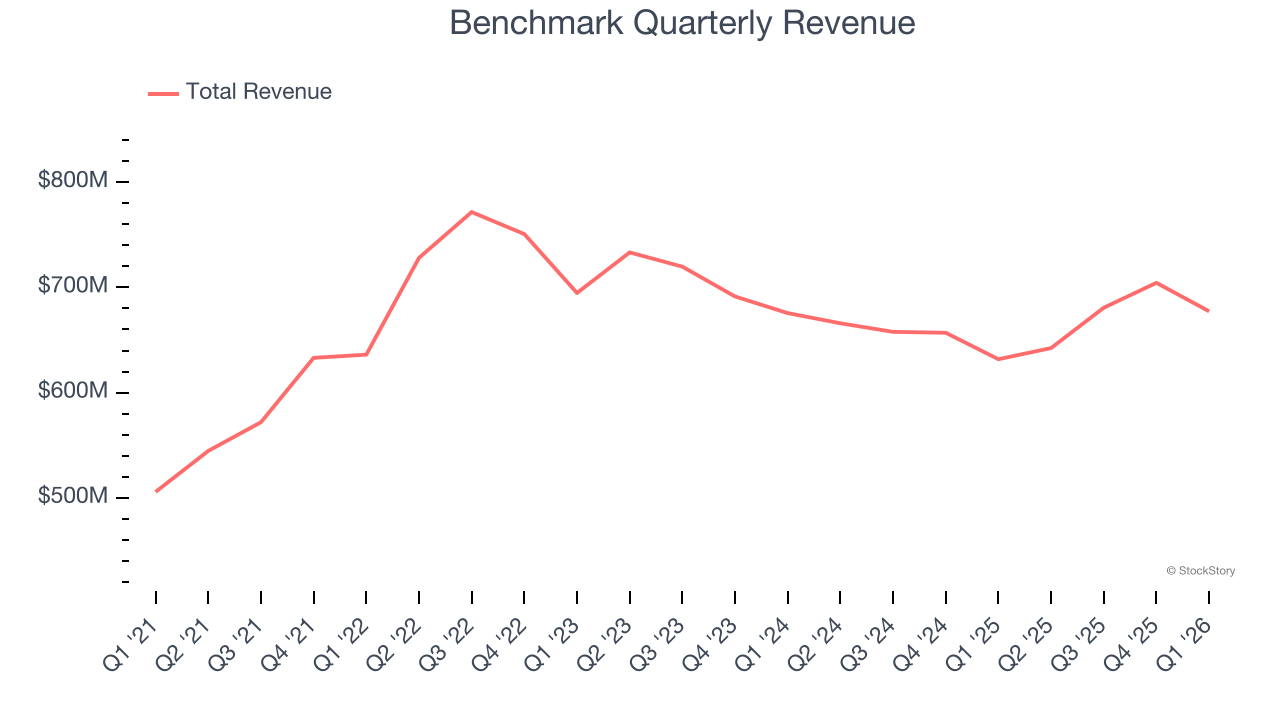
We at StockStory place the most emphasis on long-term growth, but within business services, a half-decade historical view may miss recent innovations or disruptive industry trends. Benchmark’s recent performance marks a sharp pivot from its five-year trend as its revenue has shown annualized declines of 2.1% over the last two years. 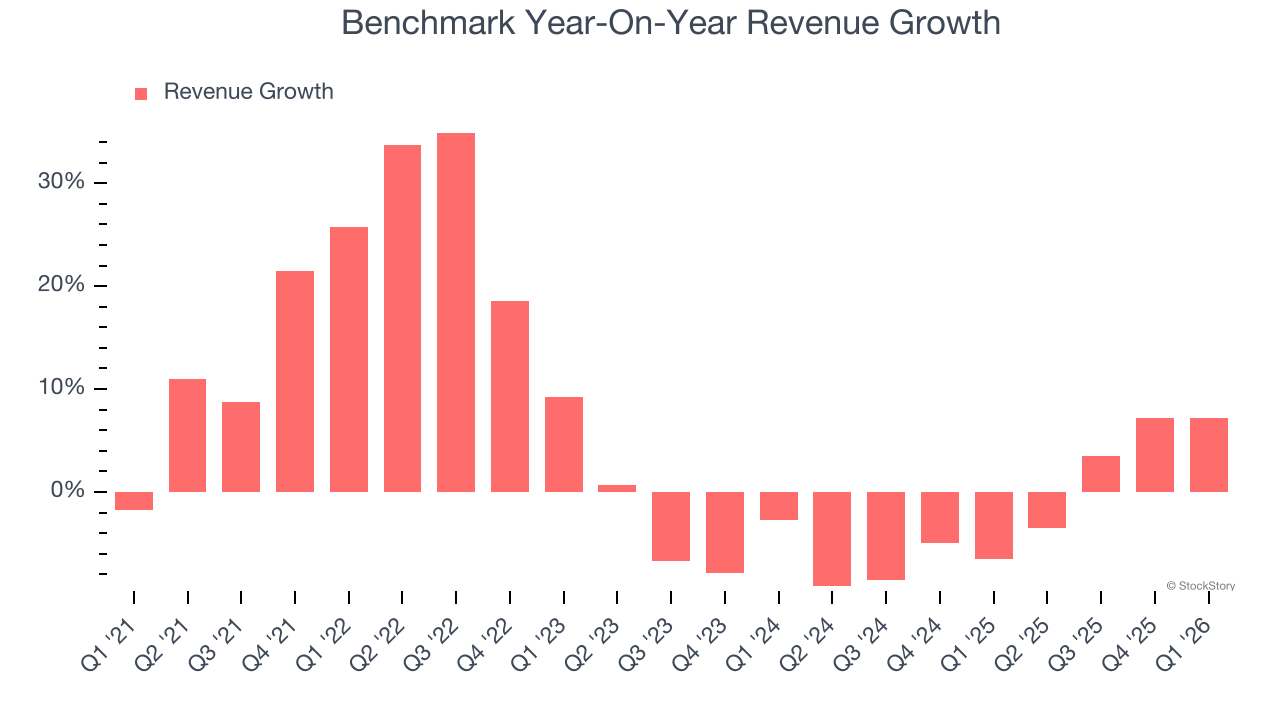
This quarter, Benchmark grew its revenue by 7.2% year on year, and its $677.3 million of revenue was in line with Wall Street’s estimates. Company management is currently guiding for a 12.1% year-on-year increase in sales next quarter.
Looking further ahead, sell-side analysts expect revenue to grow 5.6% over the next 12 months, an improvement versus the last two years. This projection is above the sector average and implies its newer products and services will fuel better top-line performance.
ONE MORE THING: The $21 AI Application Stock Wall Street Forgot. While Wall Street obsesses over who’s building AI, one company is already using it to print money. And nobody’s paying attention.
AI chip stocks trade at ridiculous valuations. This company processes a trillion consumer signals monthly using AI and trades at a third of the price. The gap won’t last. The institutions will figure it out. You need to see this first. Read the FREE Report Before They Notice.
Adjusted Operating Margin
Benchmark’s adjusted operating margin has more or less stayed the same over the last 12 months , averaging 4.3% over the last five years. This profitability was lousy for a business services business and caused by its suboptimal cost structure.
Looking at the trend in its profitability, Benchmark’s adjusted operating margin might fluctuated slightly but has generally stayed the same over the last five years. This raises questions about the company’s expense base because its revenue growth should have given it leverage on its fixed costs, resulting in better economies of scale and profitability.
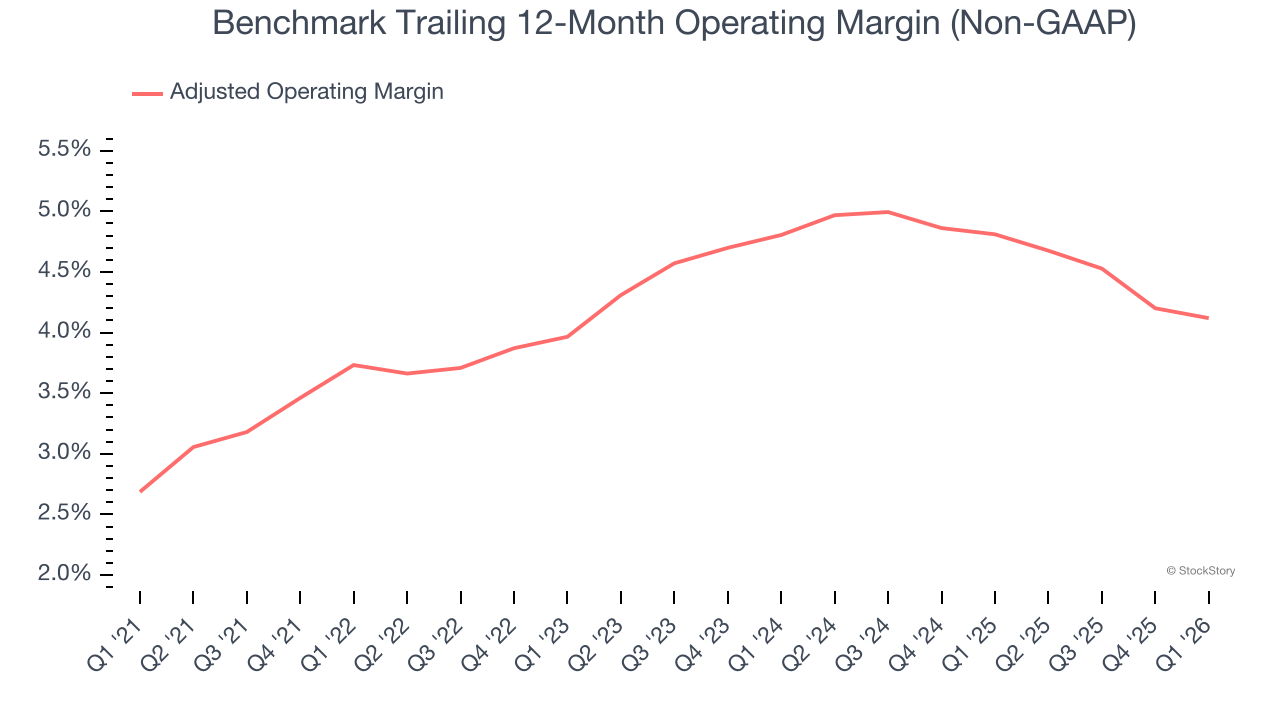
In Q1, Benchmark generated an adjusted operating margin profit margin of 4%, in line with the same quarter last year. This indicates the company’s overall cost structure has been relatively stable.
Earnings Per Share
Revenue trends explain a company’s historical growth, but the long-term change in earnings per share (EPS) points to the profitability of that growth – for example, a company could inflate its sales through excessive spending on advertising and promotions.
Benchmark’s EPS grew at 21.2% compounded annual growth rate over the last five years, higher than its 5.8% annualized revenue growth. This tells us the company became more profitable on a per-share basis as it expanded.
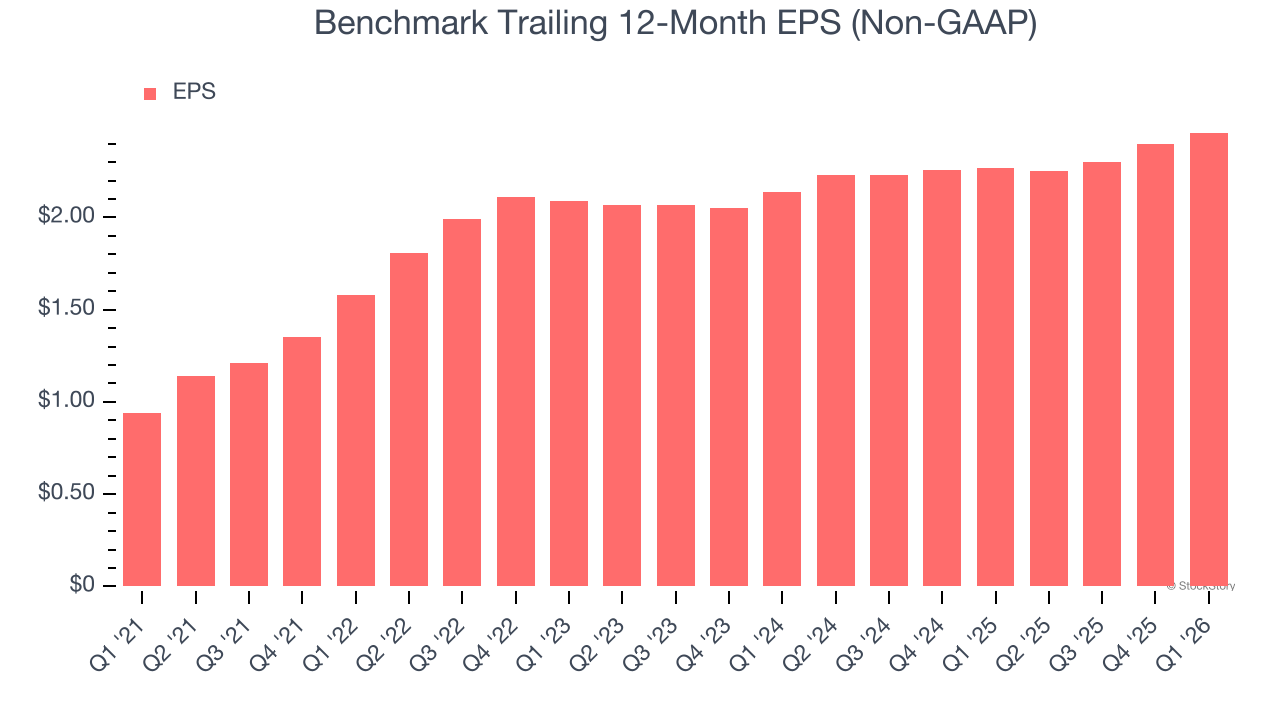
Like with revenue, we analyze EPS over a shorter period to see if we are missing a change in the business.
For Benchmark, its two-year annual EPS growth of 7.2% was lower than its five-year trend. We hope its growth can accelerate in the future.
In Q1, Benchmark reported adjusted EPS of $0.58, up from $0.52 in the same quarter last year. This print beat analysts’ estimates by 4.8%. Over the next 12 months, Wall Street expects Benchmark’s full-year EPS of $2.46 to grow 7.3%.
Key Takeaways from Benchmark’s Q1 Results
We were impressed by how significantly Benchmark blew past analysts’ EPS guidance for next quarter expectations this quarter. We were also glad its revenue and EPS guidance for next quarter both trumped Wall Street’s estimates. Zooming out, we think this was a very good print. The stock traded up 13.9% to $82.39 immediately following the results.
Benchmark had an encouraging quarter, but one earnings result doesn’t necessarily make the stock a buy. Let’s see if this is a good investment. What happened in the latest quarter matters, but not as much as longer-term business quality and valuation, when deciding whether to invest in this stock. We cover that in our actionable full research report which you can read here (it’s free).


