


Medical tech company CONMED (NYSE: CNMD) reported Q1 CY2026 results beating Wall Street’s revenue expectations, but sales fell by 1.3% year on year to $317 million. The company expects the full year’s revenue to be around $1.36 billion, close to analysts’ estimates. Its non-GAAP profit of $0.89 per share was 8.8% above analysts’ consensus estimates.
Is now the time to buy CONMED? Find out by accessing our full research report, it’s free.
CONMED (CNMD) Q1 CY2026 Highlights:
- Revenue: $317 million vs analyst estimates of $310.5 million (1.3% year-on-year decline, 2.1% beat)
- Adjusted EPS: $0.89 vs analyst estimates of $0.82 (8.8% beat)
- Adjusted EBITDA: $56.39 million vs analyst estimates of $55.59 million (17.8% margin, 1.4% beat)
- The company slightly lifted its revenue guidance for the full year to $1.36 billion at the midpoint from $1.36 billion
- Management reiterated its full-year Adjusted EPS guidance of $4.38 at the midpoint
- Operating Margin: 8%, up from 5% in the same quarter last year
- Constant Currency Revenue rose 2.9% year on year, in line with the same quarter last year
- Market Capitalization: $1.11 billion
Company Overview
With over five decades of experience in surgical innovation since its founding in 1970, CONMED (NYSE: CNMD) develops and manufactures medical devices and equipment for surgical procedures, specializing in orthopedic and general surgery products.
Revenue Growth
Reviewing a company’s long-term sales performance reveals insights into its quality. Any business can put up a good quarter or two, but many enduring ones grow for years. Luckily, CONMED’s sales grew at a decent 9.2% compounded annual growth rate over the last five years. Its growth was slightly above the average healthcare company and shows its offerings resonate with customers.
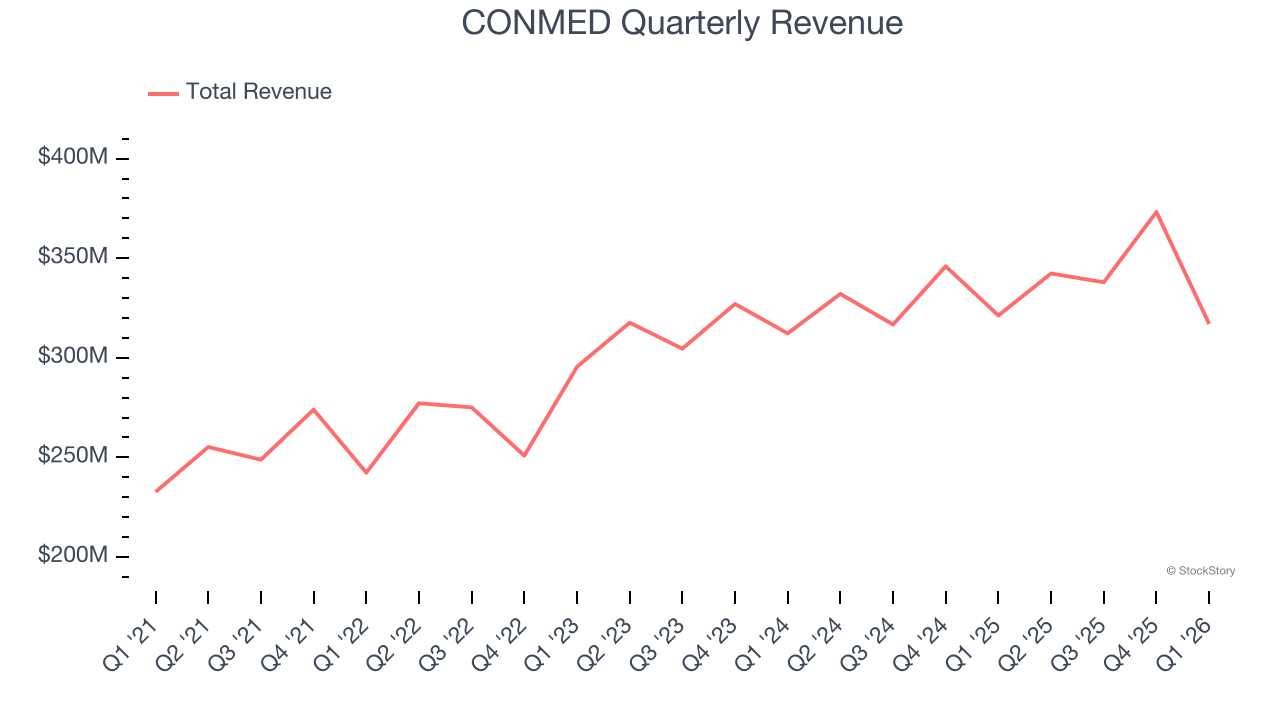
We at StockStory place the most emphasis on long-term growth, but within healthcare, a half-decade historical view may miss recent innovations or disruptive industry trends. CONMED’s recent performance shows its demand has slowed as its annualized revenue growth of 4.2% over the last two years was below its five-year trend. We’re wary when companies in the sector see decelerations in revenue growth, as it could signal changing consumer tastes aided by low switching costs. 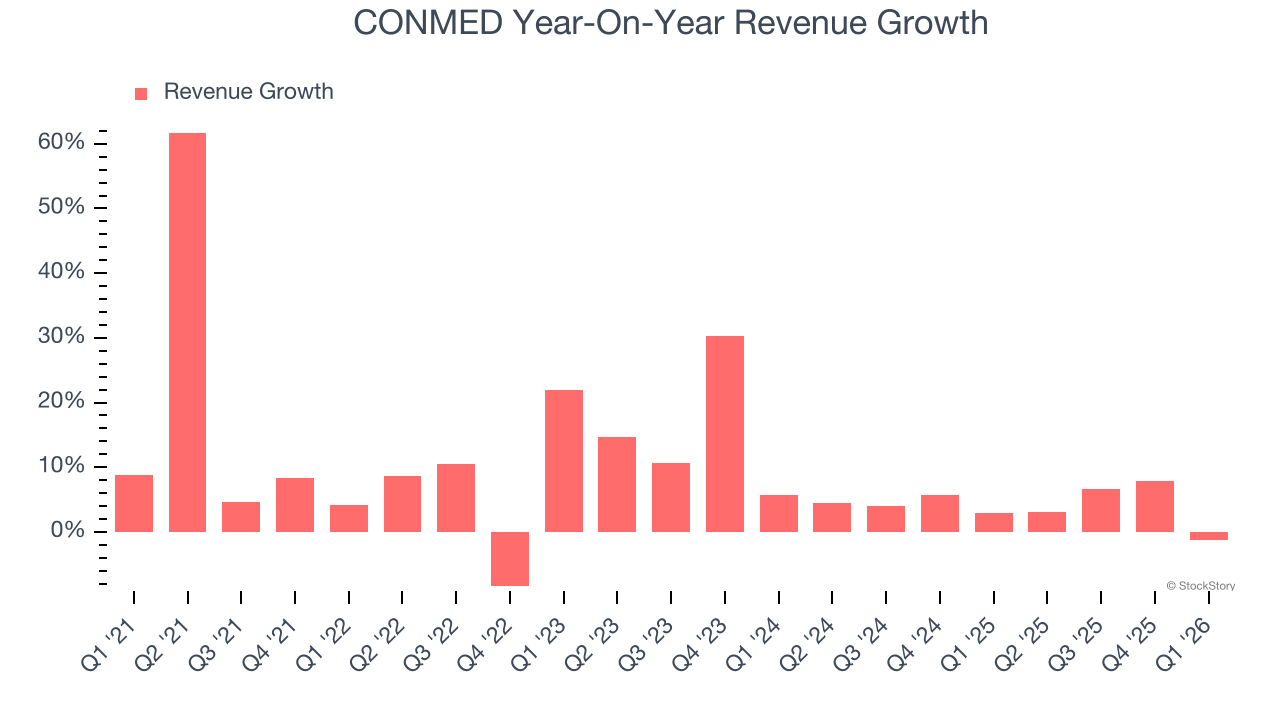
We can dig further into the company’s sales dynamics by analyzing its constant currency revenue, which excludes currency movements that are outside their control and not indicative of demand. Over the last two years, its constant currency sales averaged 4.8% year-on-year growth. Because this number aligns with its reported revenue growth, we can see that foreign exchange has not had a meaningful impact on topline. 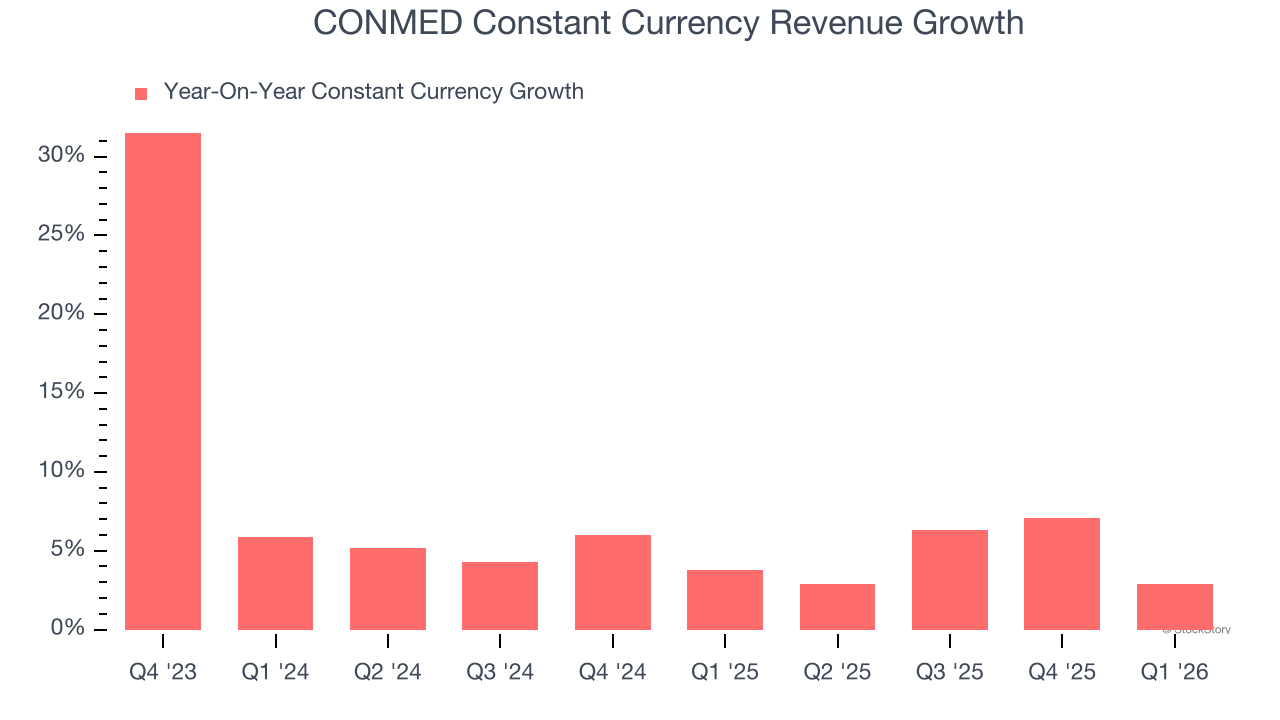
This quarter, CONMED’s revenue fell by 1.3% year on year to $317 million but beat Wall Street’s estimates by 2.1%.
Looking ahead, sell-side analysts expect revenue to remain flat over the next 12 months, a deceleration versus the last two years. This projection is underwhelming and implies its products and services will see some demand headwinds.
WHILE YOU’RE HERE: The Next Palantir? One satellite company captures images of every point on Earth. Every single day. The Pentagon wants it. Hedge funds are using it to beat earnings. You’ve probably never heard of it.
This is what the early days of Palantir looked like before it became a $437 billion giant. Same playbook. Different technology. If you missed Palantir, you need to see this. Claim The Stock Ticker for Free HERE.
Adjusted Operating Margin
CONMED’s adjusted operating margin has more or less stayed the same over the last 12 months , averaging 14.3% over the last five years. This profitability was higher than the broader healthcare sector, showing it did a decent job managing its expenses.
Analyzing the trend in its profitability, CONMED’s adjusted operating margin might fluctuated slightly but has generally stayed the same over the last five years. This raises questions about the company’s expense base because its revenue growth should have given it leverage on its fixed costs, resulting in better economies of scale and profitability.
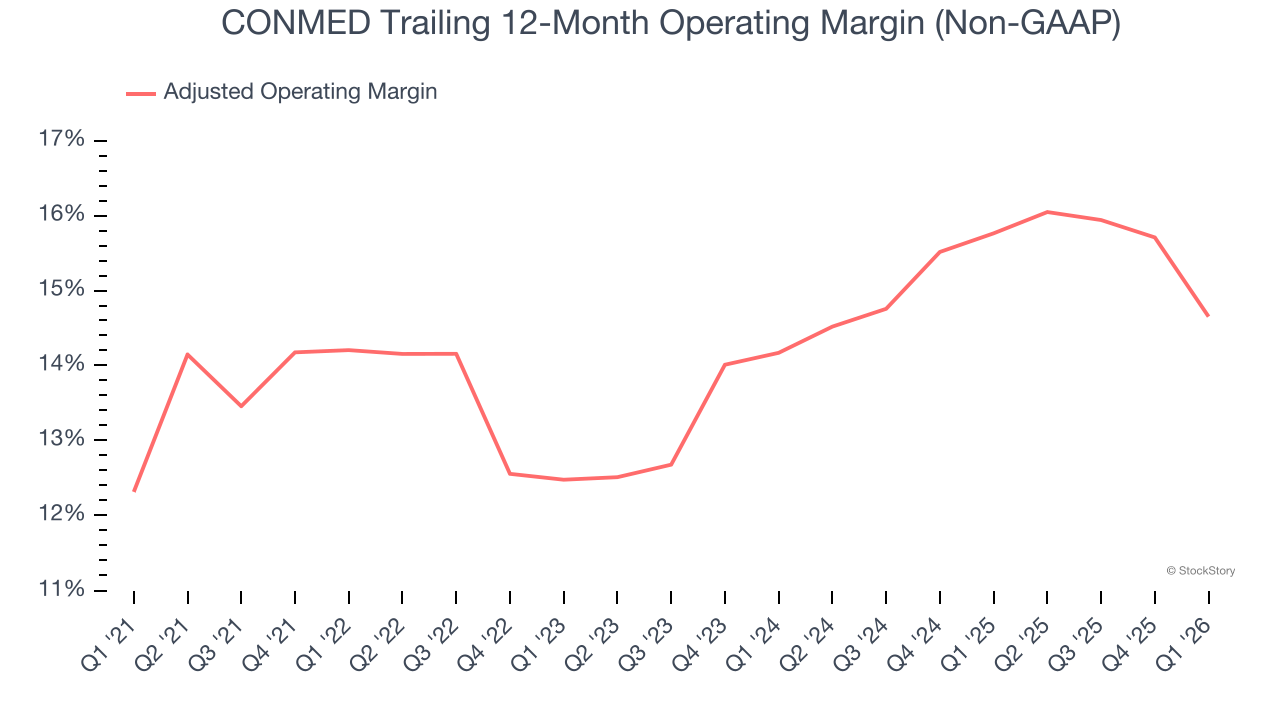
In Q1, CONMED generated an adjusted operating margin profit margin of 9.5%, down 4.6 percentage points year on year. This contraction shows it was less efficient because its expenses increased relative to its revenue.
Earnings Per Share
Revenue trends explain a company’s historical growth, but the long-term change in earnings per share (EPS) points to the profitability of that growth – for example, a company could inflate its sales through excessive spending on advertising and promotions.
CONMED’s EPS grew at 14.8% compounded annual growth rate over the last five years, higher than its 9.2% annualized revenue growth. However, this alone doesn’t tell us much about its business quality because its adjusted operating margin didn’t improve.
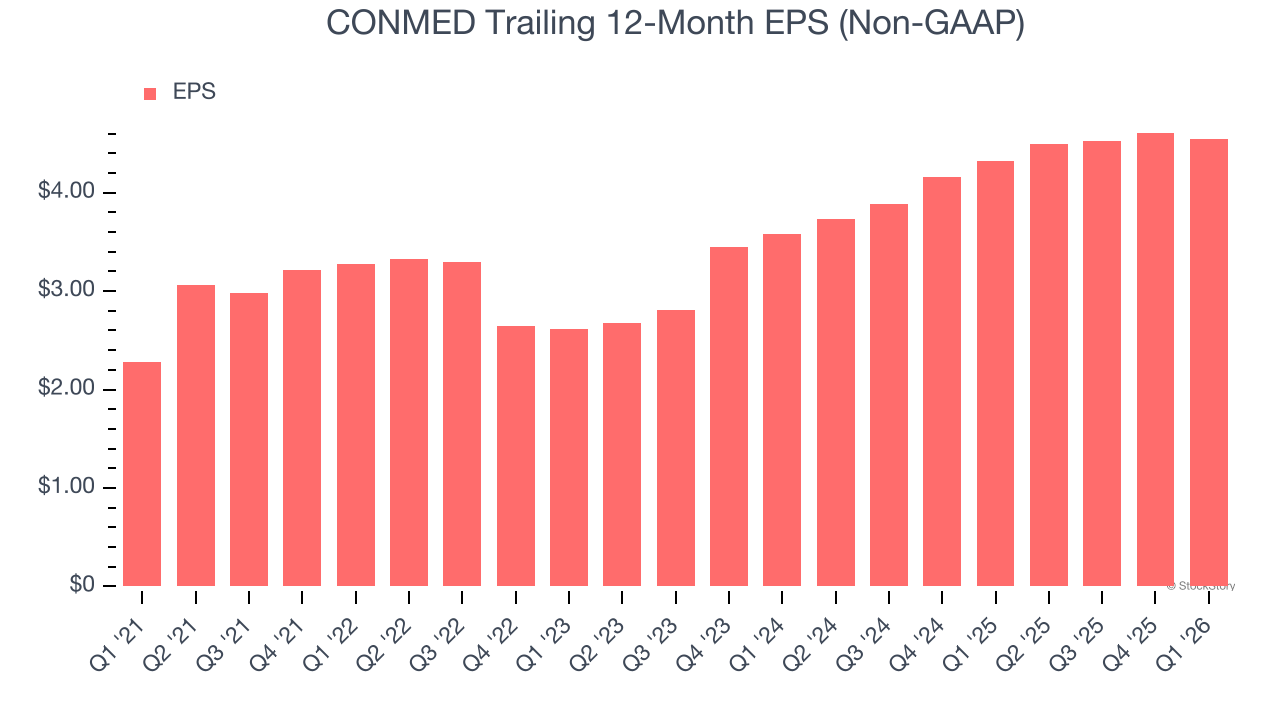
Diving into CONMED’s quality of earnings can give us a better understanding of its performance. A five-year view shows that CONMED has repurchased its stock, shrinking its share count by 2.4%. This tells us its EPS outperformed its revenue not because of increased operational efficiency but financial engineering, as buybacks boost per share earnings. 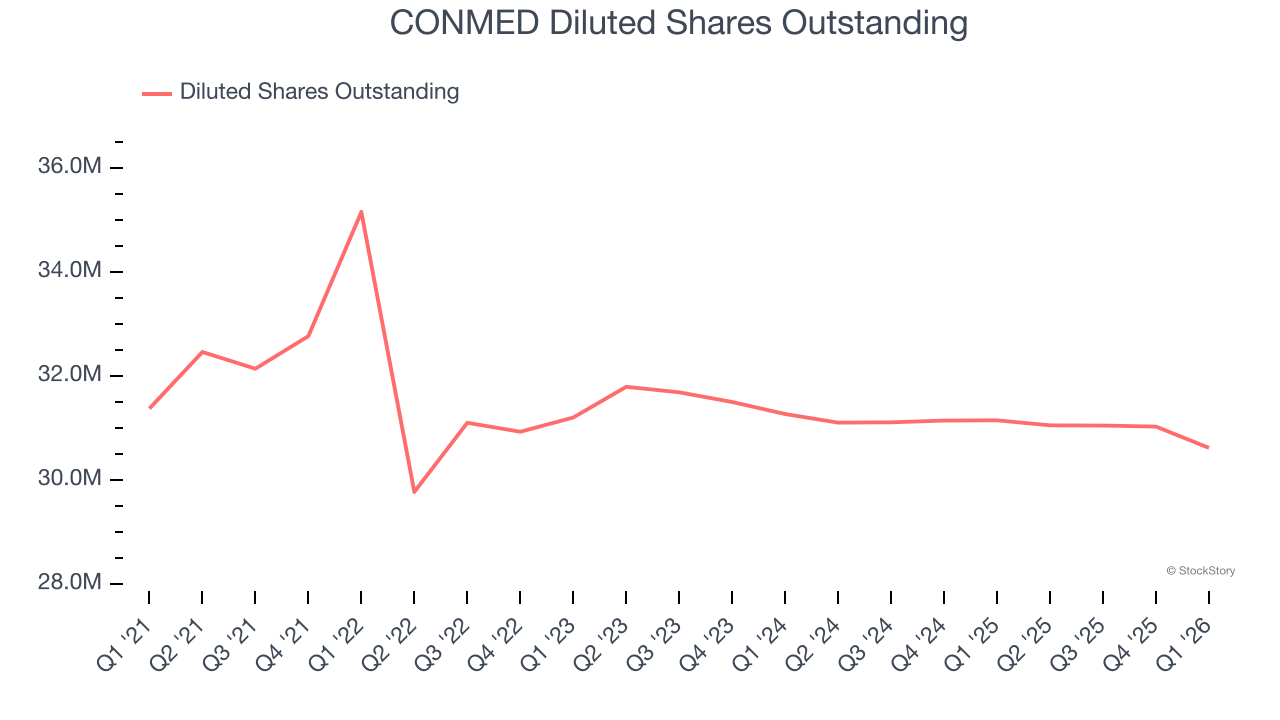
In Q1, CONMED reported adjusted EPS of $0.89, down from $0.95 in the same quarter last year. Despite falling year on year, this print beat analysts’ estimates by 8.8%. We also like to analyze expected EPS growth based on Wall Street analysts’ consensus projections, but there is insufficient data.
Key Takeaways from CONMED’s Q1 Results
It was encouraging to see CONMED beat analysts’ revenue expectations this quarter. We were also glad its EPS outperformed Wall Street’s estimates. Overall, this print had some key positives. The stock remained flat at $35.99 immediately after reporting.
Is CONMED an attractive investment opportunity right now? If you’re making that decision, you should consider the bigger picture of valuation, business qualities, as well as the latest earnings. We cover that in our actionable full research report which you can read here (it’s free).


