


Automotive manufacturer Ford (NYSE: F) reported Q1 CY2026 results topping the market’s revenue expectations, with sales up 6.5% year on year to $43.3 billion. Its non-GAAP profit of $0.66 per share was significantly above analysts’ consensus estimates.
Is now the time to buy Ford? Find out by accessing our full research report, it’s free.
Ford (F) Q1 CY2026 Highlights:
- Revenue: $43.3 billion vs analyst estimates of $41.72 billion (6.5% year-on-year growth, 3.8% beat)
- Adjusted EPS: $0.66 vs analyst estimates of $0.19 (significant beat)
- Adjusted Operating Income: $3.5 billion vs analyst estimates of $1.27 billion (8.1% margin, significant beat)
- Operating Margin: 5.4%, up from 0.8% in the same quarter last year
- Free Cash Flow was -$1.04 billion, down from $1.86 billion in the same quarter last year
- Sales Volumes were down 3.8% year on year
- Market Capitalization: $49.1 billion
Company Overview
Established to make automobiles accessible to a broader segment of the population, Ford (NYSE: F) designs, manufactures, and sells a variety of automobiles, trucks, and electric vehicles.
Revenue Growth
Examining a company’s long-term performance can provide clues about its quality. Even a bad business can shine for one or two quarters, but a top-tier one grows for years. Over the last five years, Ford grew its sales at a decent 8% compounded annual growth rate. Its growth was slightly above the average industrials company and shows its offerings resonate with customers.
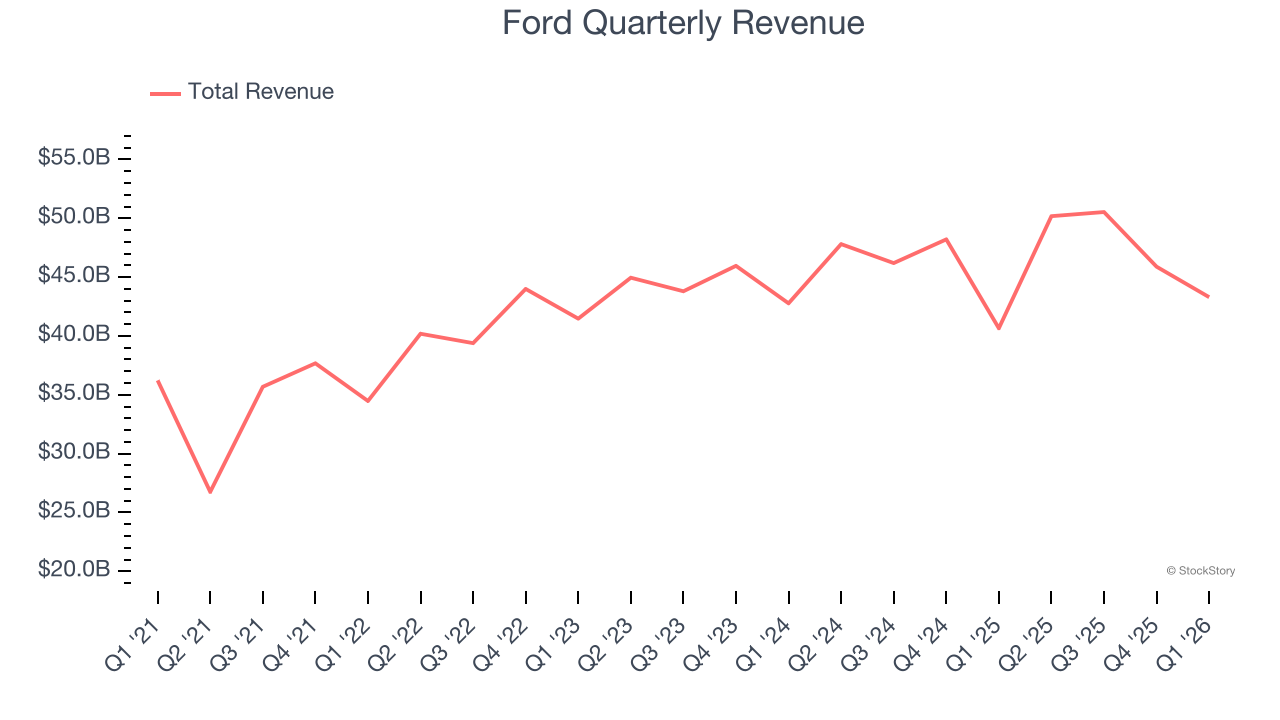
We at StockStory place the most emphasis on long-term growth, but within industrials, a half-decade historical view may miss cycles, industry trends, or a company capitalizing on catalysts such as a new contract win or a successful product line. Ford’s recent performance shows its demand has slowed as its annualized revenue growth of 3.4% over the last two years was below its five-year trend. We’re wary when companies in the sector see decelerations in revenue growth, as it could signal changing consumer tastes aided by low switching costs. 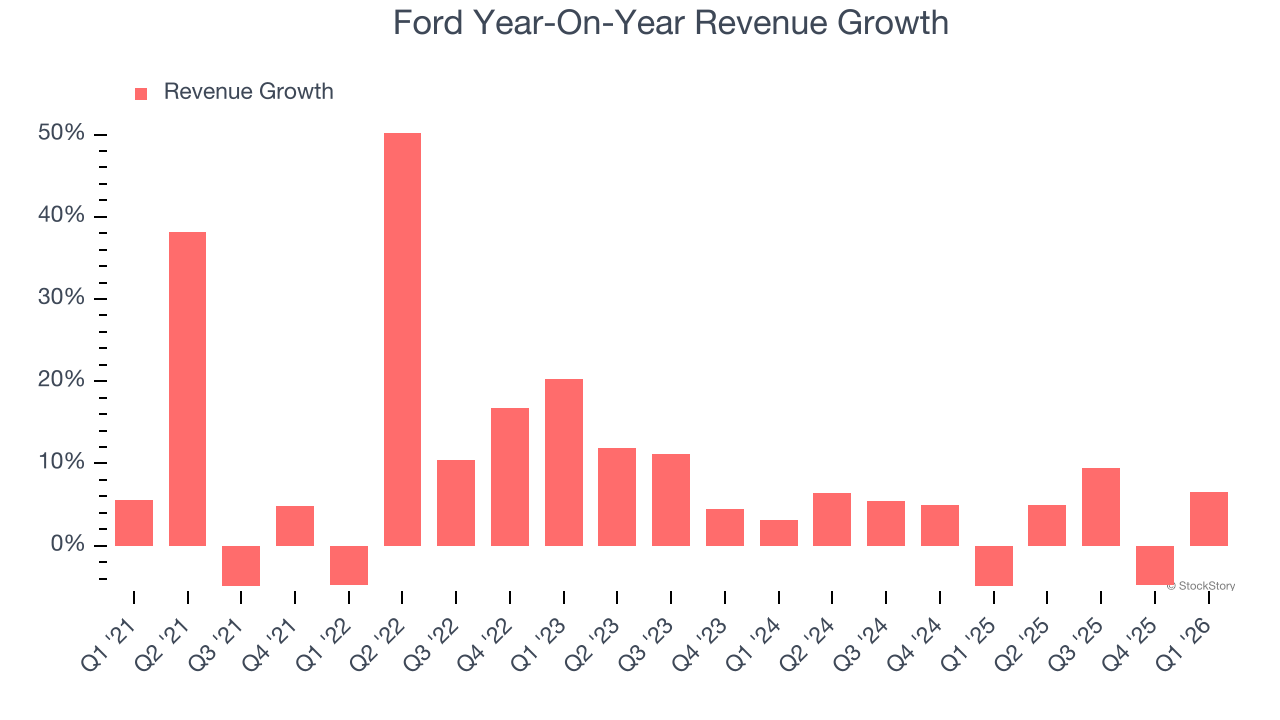
This quarter, Ford reported year-on-year revenue growth of 6.5%, and its $43.3 billion of revenue exceeded Wall Street’s estimates by 3.8%.
Looking ahead, sell-side analysts expect revenue to remain flat over the next 12 months, a deceleration versus the last two years. This projection is underwhelming and implies its products and services will see some demand headwinds.
ONE MORE THING: The $21 AI Application Stock Wall Street Forgot. While Wall Street obsesses over who’s building AI, one company is already using it to print money. And nobody’s paying attention.
AI chip stocks trade at ridiculous valuations. This company processes a trillion consumer signals monthly using AI and trades at a third of the price. The gap won’t last. The institutions will figure it out. You need to see this first. Read the FREE Report Before They Notice.
Operating Margin
Ford was profitable over the last five years but held back by its large cost base. Its average operating margin of 1.4% was weak for an industrials business. This result isn’t too surprising given its low gross margin as a starting point.
Looking at the trend in its profitability, Ford’s operating margin decreased by 6.3 percentage points over the last five years. This raises questions about the company’s expense base because its revenue growth should have given it leverage on its fixed costs, resulting in better economies of scale and profitability. Ford’s performance was poor no matter how you look at it - it shows that costs were rising and it couldn’t pass them onto its customers.
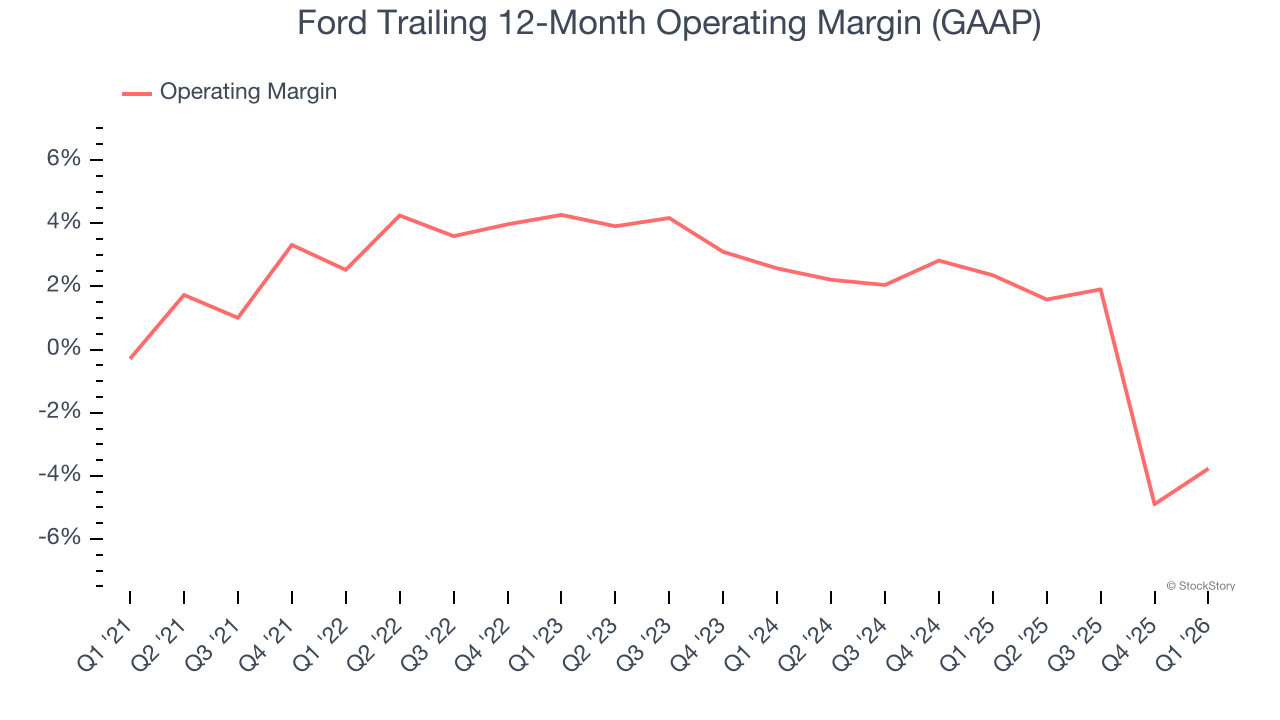
This quarter, Ford generated an operating margin profit margin of 5.4%, up 4.6 percentage points year on year. Since its gross margin expanded more than its operating margin, we can infer that leverage on its cost of sales was the primary driver behind the recently higher efficiency.
Earnings Per Share
We track the long-term change in earnings per share (EPS) for the same reason as long-term revenue growth. Compared to revenue, however, EPS highlights whether a company’s growth is profitable.
Ford’s EPS grew at a weak 1% compounded annual growth rate over the last five years, lower than its 8% annualized revenue growth. This tells us the company became less profitable on a per-share basis as it expanded.
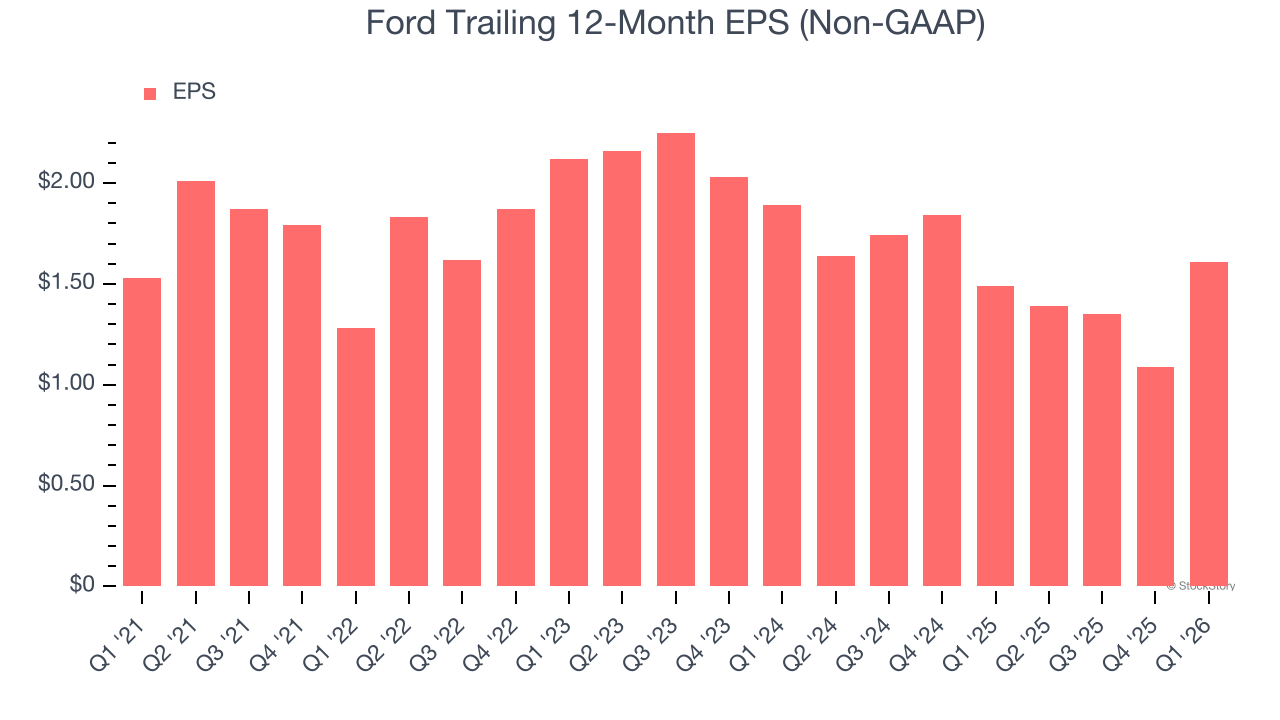
Diving into the nuances of Ford’s earnings can give us a better understanding of its performance. As we mentioned earlier, Ford’s operating margin expanded this quarter but declined by 6.3 percentage points over the last five years. Its share count also grew by 1.4%, meaning the company not only became less efficient with its operating expenses but also diluted its shareholders. 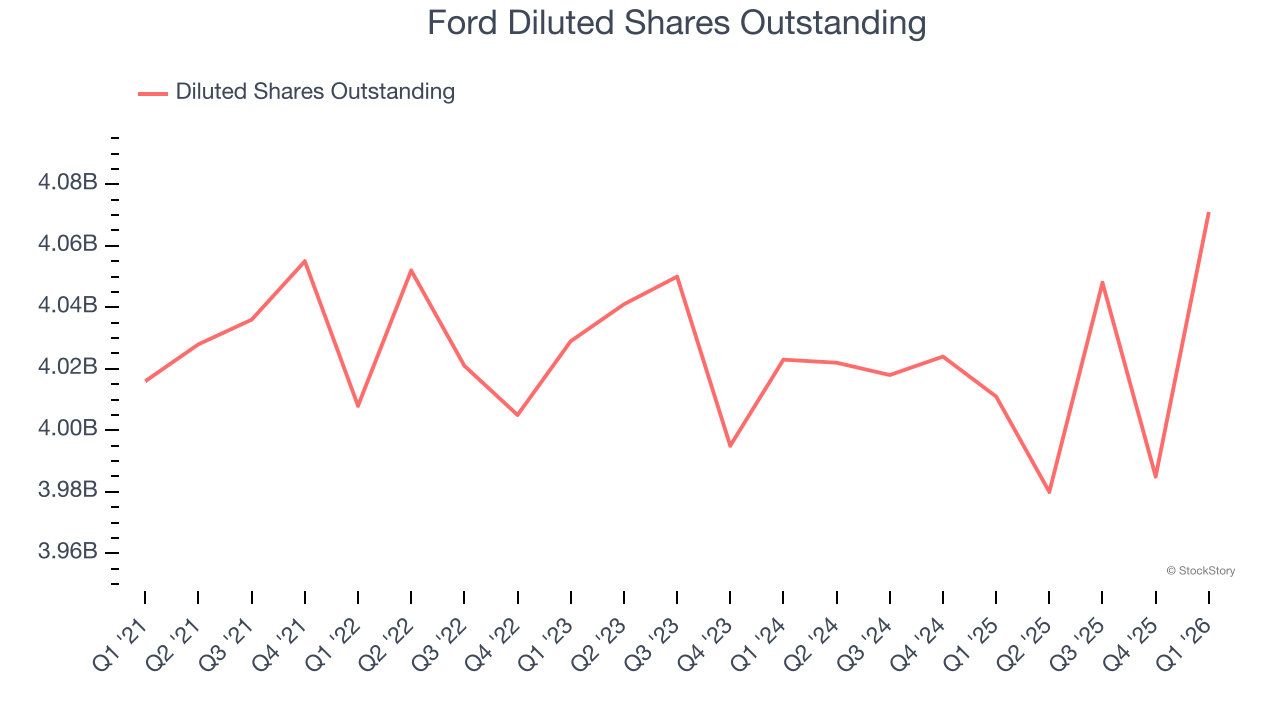
Like with revenue, we analyze EPS over a shorter period to see if we are missing a change in the business.
For Ford, its two-year annual EPS declines of 7.7% show it’s continued to underperform. These results were bad no matter how you slice the data.
In Q1, Ford reported adjusted EPS of $0.66, up from $0.14 in the same quarter last year. This print easily cleared analysts’ estimates, and shareholders should be content with the results. Over the next 12 months, Wall Street expects Ford’s full-year EPS of $1.61 to grow 6%.
Key Takeaways from Ford’s Q1 Results
It was good to see Ford beat analysts’ EPS expectations this quarter. We were also excited its adjusted operating income outperformed Wall Street’s estimates by a wide margin. Zooming out, we think this quarter featured some important positives. The market seemed to be hoping for more, and the stock traded down 1.5% to $12.06 immediately following the results.
So should you invest in Ford right now? What happened in the latest quarter matters, but not as much as longer-term business quality and valuation, when deciding whether to invest in this stock. We cover that in our actionable full research report which you can read here (it’s free).


