


Electrical construction and infrastructure services provider MYR Group (NASDAQ: MYRG) reported Q1 CY2026 results beating Wall Street’s revenue expectations, with sales up 20% year on year to $1 billion. Its GAAP profit of $2.99 per share was 46% above analysts’ consensus estimates.
Is now the time to buy MYR Group? Find out by accessing our full research report, it’s free.
MYR Group (MYRG) Q1 CY2026 Highlights:
- Revenue: $1 billion vs analyst estimates of $930.3 million (20% year-on-year growth, 7.5% beat)
- EPS (GAAP): $2.99 vs analyst estimates of $2.05 (46% beat)
- Adjusted EBITDA: $81.54 million vs analyst estimates of $61.54 million (8.2% margin, 32.5% beat)
- Operating Margin: 6.5%, up from 4.1% in the same quarter last year
- Free Cash Flow Margin: 6.9%, down from 8.4% in the same quarter last year
- Backlog: $2.84 billion at quarter end, up 7.6% year on year
- Market Capitalization: $5.14 billion
Company Overview
Constructing electrical and phone lines in the American Midwest dating back to the 1890s, MYR Group (NASDAQ: MYRG) is a specialty contractor in the electrical construction industry.
Revenue Growth
Examining a company’s long-term performance can provide clues about its quality. Any business can put up a good quarter or two, but many enduring ones grow for years. Luckily, MYR Group’s sales grew at an impressive 10.5% compounded annual growth rate over the last five years. Its growth beat the average industrials company and shows its offerings resonate with customers.
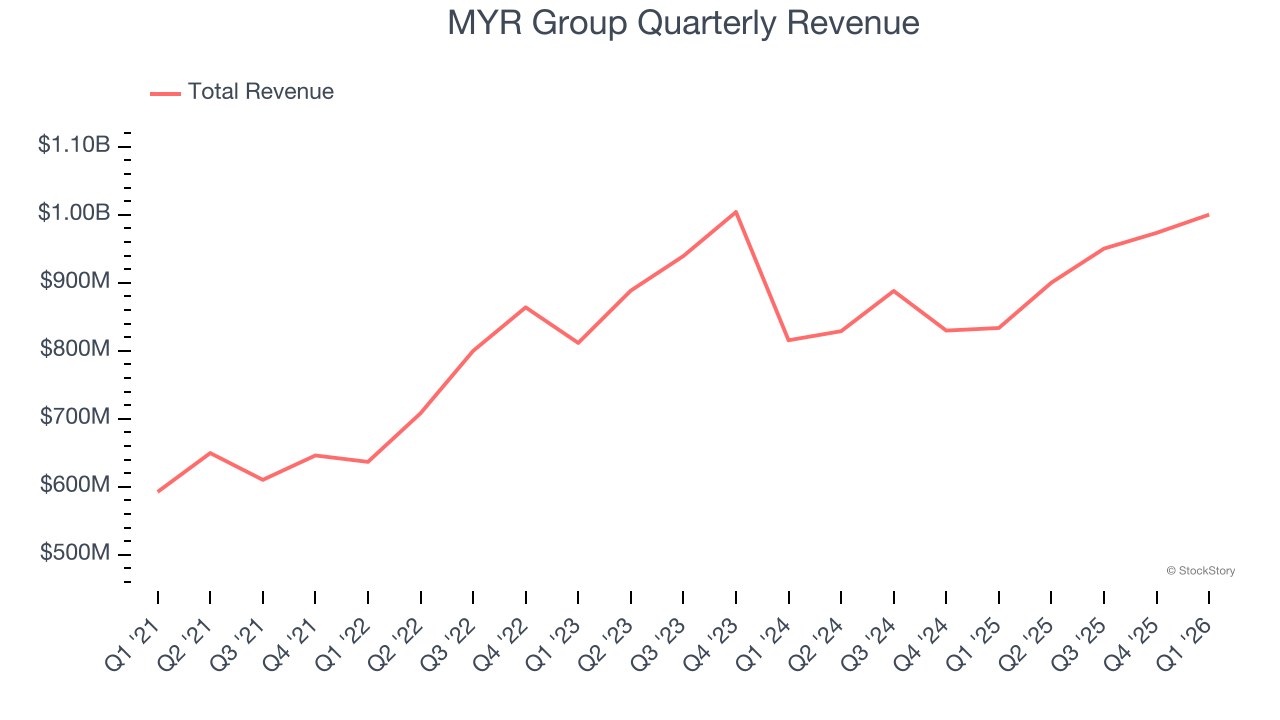
We at StockStory place the most emphasis on long-term growth, but within industrials, a half-decade historical view may miss cycles, industry trends, or a company capitalizing on catalysts such as a new contract win or a successful product line. MYR Group’s recent performance shows its demand has slowed significantly as its annualized revenue growth of 2.4% over the last two years was well below its five-year trend. 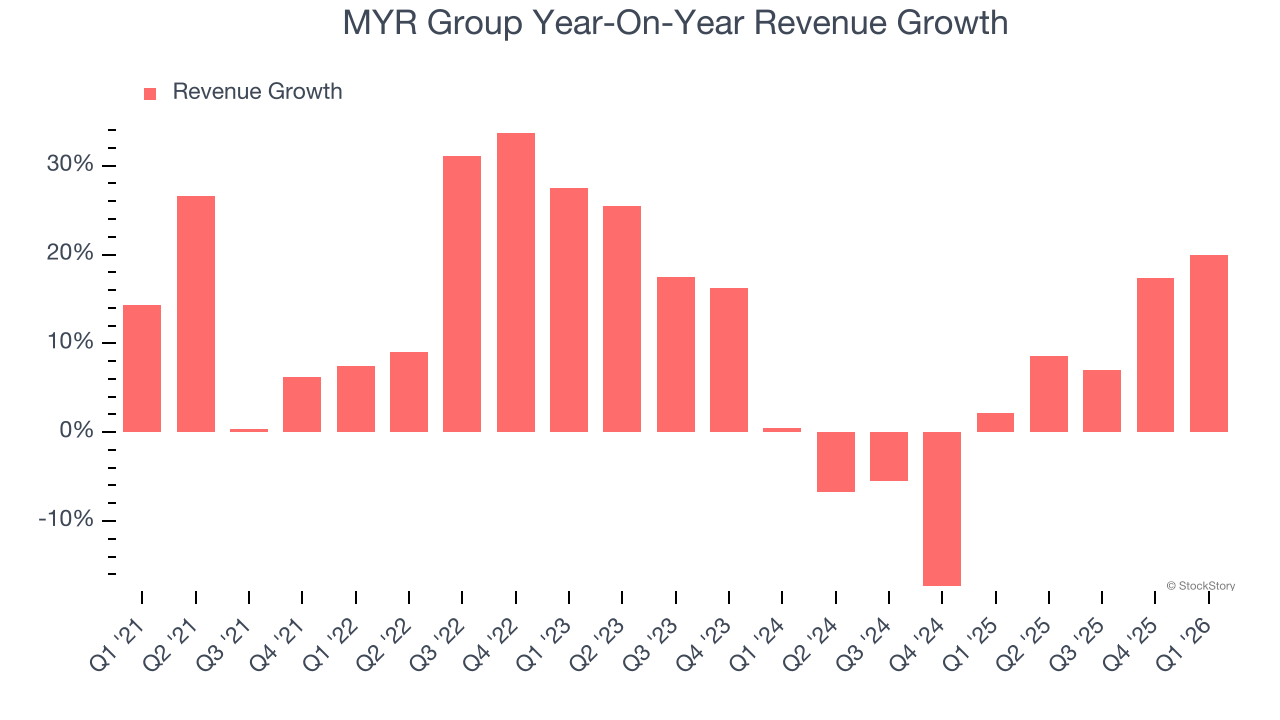
We can better understand the company’s revenue dynamics by analyzing its backlog, or the value of its outstanding orders that have not yet been executed or delivered. MYR Group’s backlog reached $2.84 billion in the latest quarter and averaged 5.8% year-on-year growth over the last two years. Because this number is better than its revenue growth, we can see the company accumulated more orders than it could fulfill and deferred revenue to the future. This could imply elevated demand for MYR Group’s products and services but raises concerns about capacity constraints. 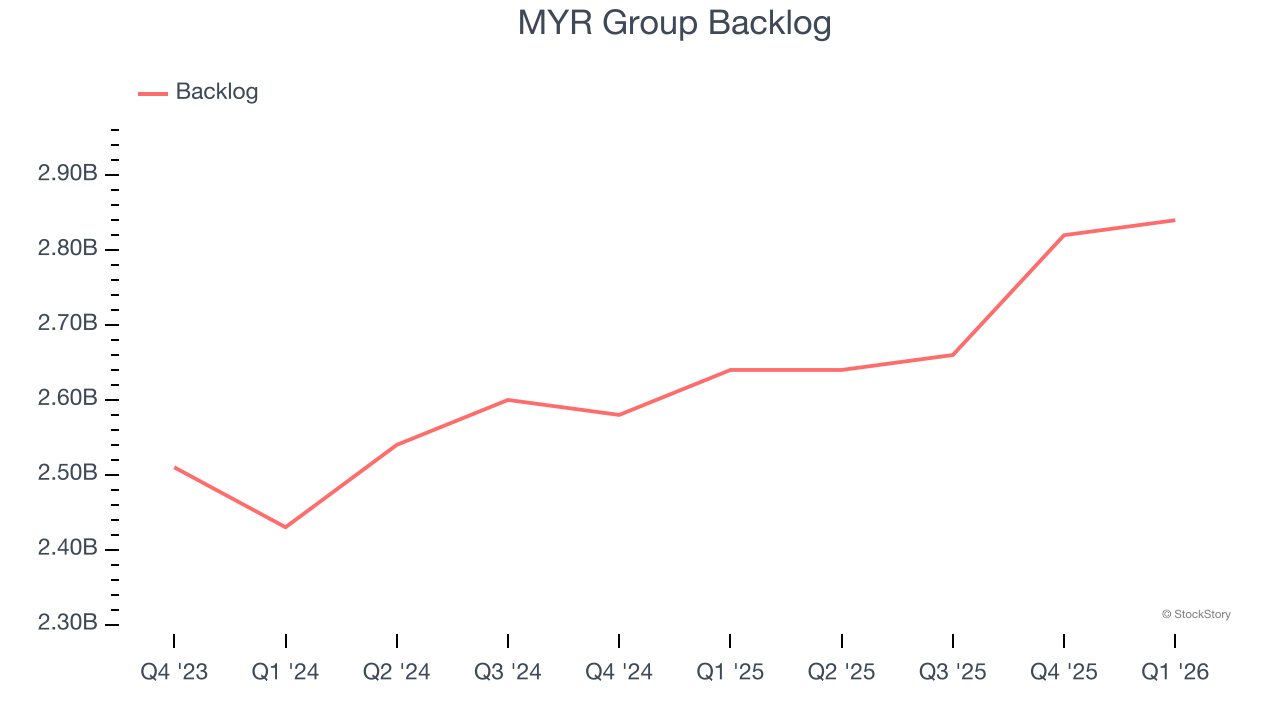
This quarter, MYR Group reported robust year-on-year revenue growth of 20%, and its $1 billion of revenue topped Wall Street estimates by 7.5%.
Looking ahead, sell-side analysts expect revenue to grow 6.9% over the next 12 months. While this projection suggests its newer products and services will catalyze better top-line performance, it is still below the sector average.
WHILE YOU’RE HERE: The Next Palantir? One satellite company captures images of every point on Earth. Every single day. The Pentagon wants it. Hedge funds are using it to beat earnings. You’ve probably never heard of it.
This is what the early days of Palantir looked like before it became a $437 billion giant. Same playbook. Different technology. If you missed Palantir, you need to see this. Claim The Stock Ticker for Free HERE.
Operating Margin
MYR Group’s operating margin has been trending up over the last 12 months and averaged 3.7% over the last five years. The company’s higher efficiency is a breath of fresh air, but its suboptimal cost structure means it still sports lousy profitability for an industrials business. This result isn’t too surprising given its low gross margin as a starting point.
Looking at the trend in its profitability, MYR Group’s operating margin might fluctuated slightly but has generally stayed the same over the last five years. This raises questions about the company’s expense base because its revenue growth should have given it leverage on its fixed costs, resulting in better economies of scale and profitability.
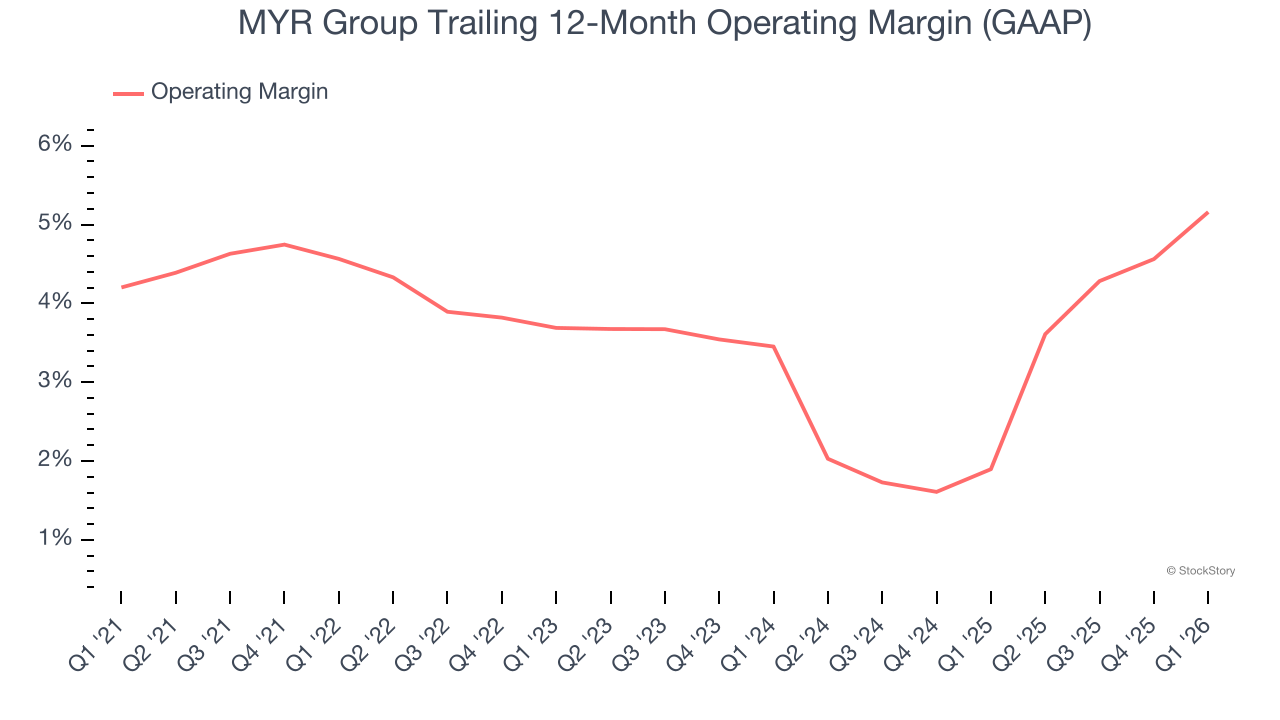
In Q1, MYR Group generated an operating margin profit margin of 6.5%, up 2.4 percentage points year on year. The increase was encouraging, and because its operating margin rose more than its gross margin, we can infer it was more efficient with expenses such as marketing, R&D, and administrative overhead.
Earnings Per Share
Revenue trends explain a company’s historical growth, but the long-term change in earnings per share (EPS) points to the profitability of that growth – for example, a company could inflate its sales through excessive spending on advertising and promotions.
MYR Group’s EPS grew at 17.5% compounded annual growth rate over the last five years, higher than its 10.5% annualized revenue growth. This tells us the company became more profitable on a per-share basis as it expanded.
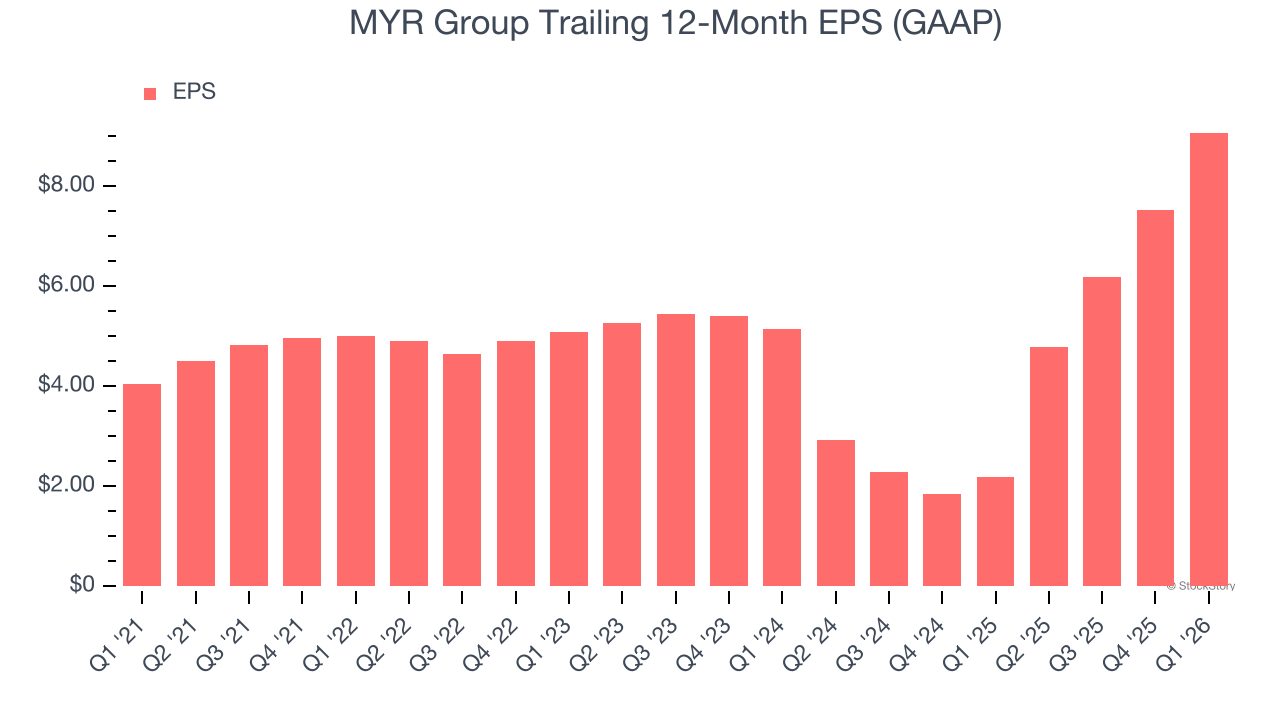
Diving into MYR Group’s quality of earnings can give us a better understanding of its performance. A five-year view shows that MYR Group has repurchased its stock, shrinking its share count by 8%. This tells us its EPS outperformed its revenue not because of increased operational efficiency but financial engineering, as buybacks boost per share earnings. 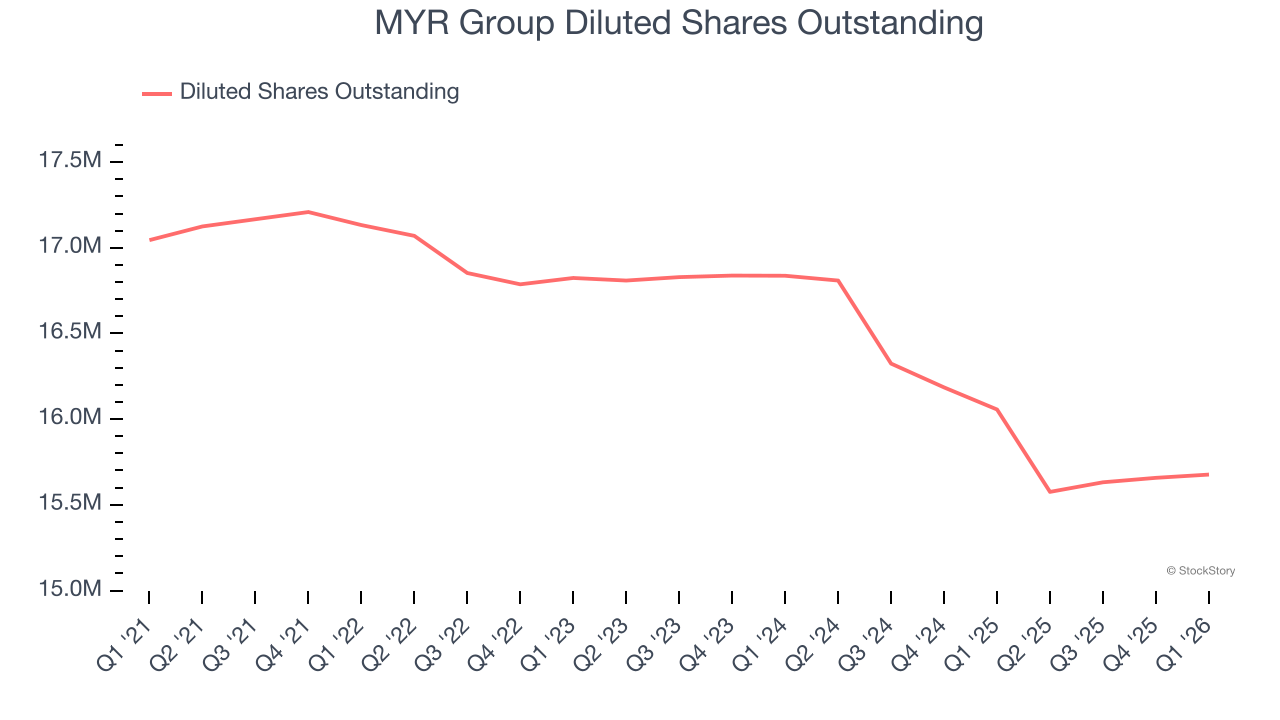
Like with revenue, we analyze EPS over a shorter period to see if we are missing a change in the business.
For MYR Group, its two-year annual EPS growth of 32.7% was higher than its five-year trend. We love it when earnings growth accelerates, especially when it accelerates off an already high base.
In Q1, MYR Group reported EPS of $2.99, up from $1.45 in the same quarter last year. This print easily cleared analysts’ estimates, and shareholders should be content with the results. Over the next 12 months, Wall Street expects MYR Group’s full-year EPS of $9.08 to grow 1.5%.
Key Takeaways from MYR Group’s Q1 Results
It was good to see MYR Group beat analysts’ EPS expectations this quarter. We were also excited its EBITDA outperformed Wall Street’s estimates by a wide margin. Zooming out, we think this was a good print with some key areas of upside. The stock remained flat at $337.90 immediately following the results.
Is MYR Group an attractive investment opportunity at the current price? We think that the latest quarter is only one piece of the longer-term business quality puzzle. Quality, when combined with valuation, can help determine if the stock is a buy. We cover that in our actionable full research report which you can read here (it’s free).


