


Over the past six months, Nelnet has been a great trade, beating the S&P 500 by 8.4%. Its stock price has climbed to $144.14, representing a healthy 12.4% increase. This performance may have investors wondering how to approach the situation.
Is there a buying opportunity in Nelnet, or does it present a risk to your portfolio? Check out our in-depth research report to see what our analysts have to say, it’s free.
Why Is Nelnet Not Exciting?
We’re glad investors have benefited from the price increase, but we're sitting this one out for now. Here are three reasons there are better opportunities than NNI and a stock we'd rather own.
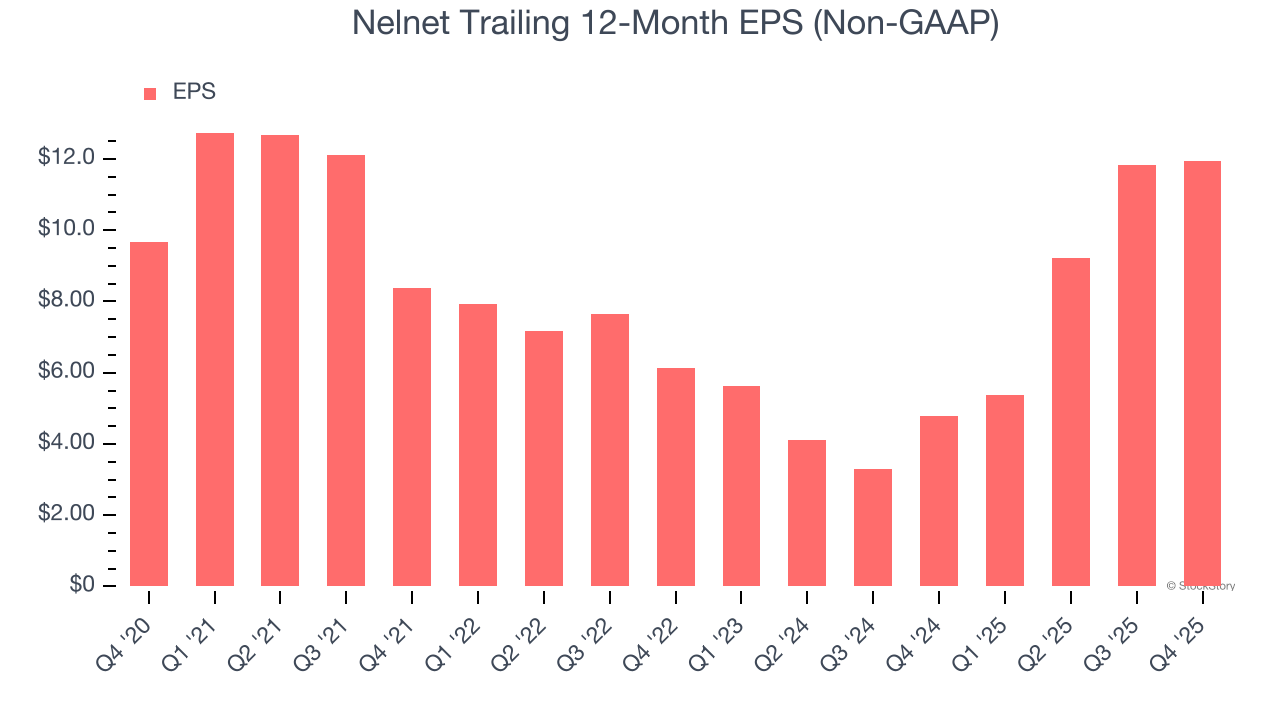
1. EPS Barely Growing
We track the long-term change in earnings per share (EPS) because it highlights whether a company’s growth is profitable.
Nelnet’s EPS grew at a weak 4.3% compounded annual growth rate over the last five years, lower than its 8.6% annualized revenue growth. This tells us the company became less profitable on a per-share basis as it expanded.
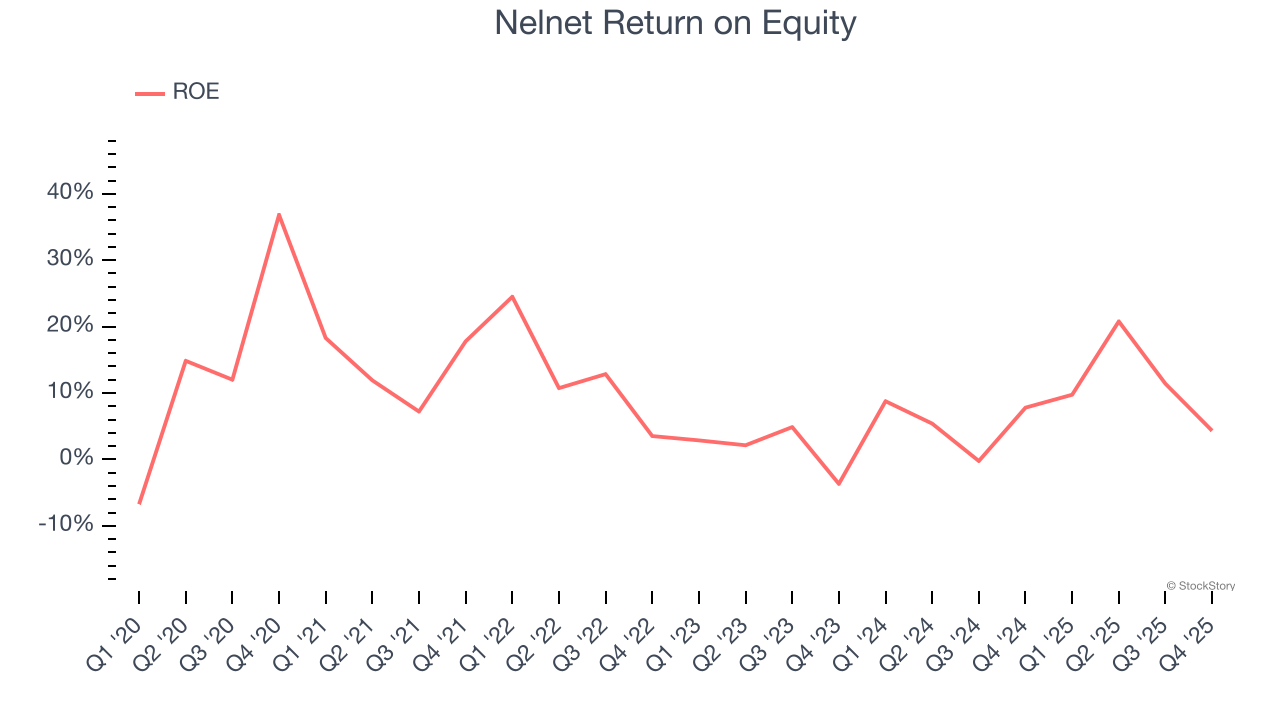
2. Previous Growth Initiatives Haven’t Impressed
Return on equity, or ROE, tells us how much profit a company generates for each dollar of shareholder equity, a key funding source for banks. Over a long period, banks with high ROE tend to compound shareholder wealth faster through retained earnings, buybacks, and dividends.
Over the last five years, Nelnet has averaged an ROE of 9%, uninspiring for a company operating in a sector where the average shakes out around 10%.
3. High Debt Levels Increase Risk
Nelnet reported $973.5 million of cash and $7.79 billion of debt on its balance sheet in the most recent quarter.
As investors in high-quality companies, we primarily focus on whether a company’s profits can support its debt.
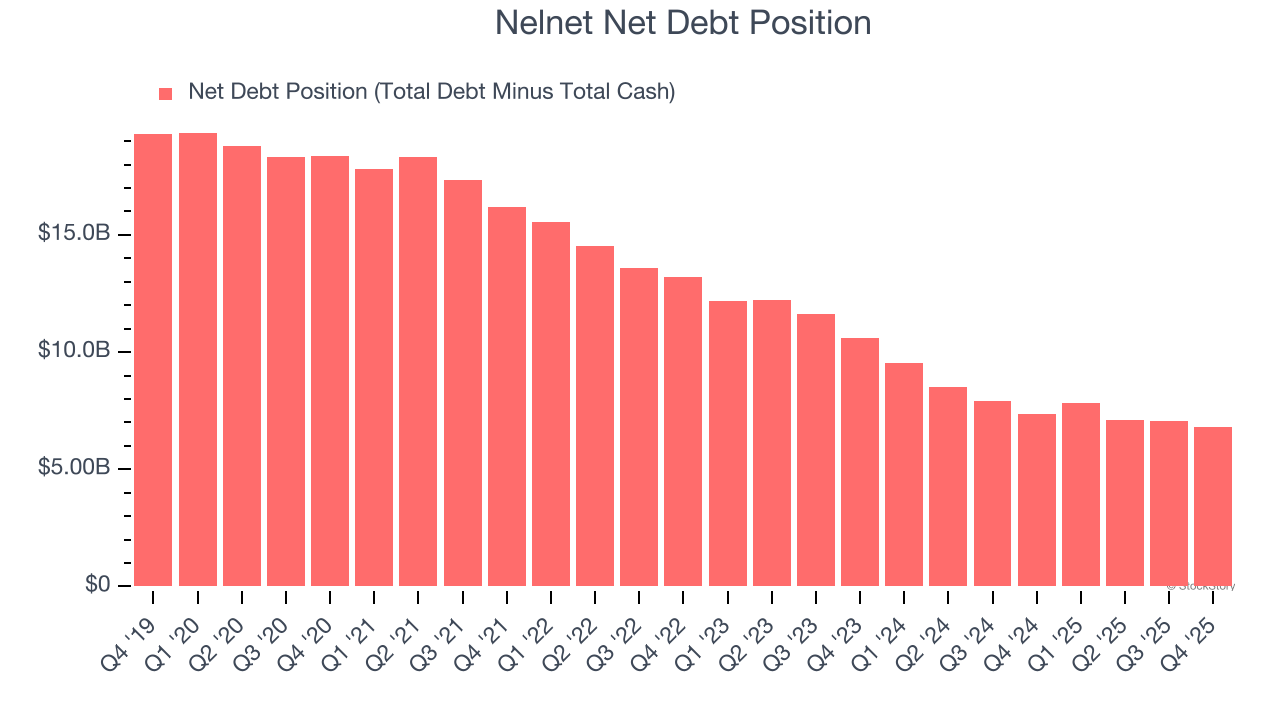
With $565.8 million of EBITDA over the last 12 months, we view Nelnet’s 12.0× net-debt-to-EBITDA ratio as inadequate. The company’s lacking profits relative to its borrowings give it little breathing room, raising red flags.
Final Judgment
Nelnet’s business quality ultimately falls short of our standards. With its shares topping the market in recent months, the stock trades at 15.5× forward P/E (or $144.14 per share). Investors with a higher risk tolerance might like the company, but we think the potential downside is too great. We're fairly confident there are better investments elsewhere. Let us point you toward an all-weather company that owns household favorite Taco Bell.
Stocks We Like More Than Nelnet
WHILE YOU’RE HERE: Top 9 Market-Beating Stocks. The best stocks don't just beat the market once. They do it again. And again. Robust revenue growth, rising free cash flow, returns on capital that leave their competition in the dust. The market has already rewarded these businesses.
But our AI platform says the party isn't over. Find out which 9 stocks made the cut this week — FREE. Get Our Top 9 Market-Beating Stocks for Free HERE.
Stocks that have made our list include now familiar names such as Nvidia (+1,326% between June 2020 and June 2025) as well as under-the-radar businesses like the once-micro-cap company Kadant (+351% five-year return). Find your next big winner with StockStory today.


