


Funeral services company Service International (NYSE: SCI) met Wall Street’s revenue expectations in Q1 CY2026, with sales up 2.1% year on year to $1.10 billion. Its non-GAAP profit of $0.97 per share was 2.8% below analysts’ consensus estimates.
Is now the time to buy Service International? Find out by accessing our full research report, it’s free.
Service International (SCI) Q1 CY2026 Highlights:
- Revenue: $1.10 billion vs analyst estimates of $1.09 billion (2.1% year-on-year growth, in line)
- Adjusted EPS: $0.97 vs analyst expectations of $1.00 (2.8% miss)
- Adjusted EBITDA: $304.7 million vs analyst estimates of $337.1 million (27.8% margin, 9.6% miss)
- Management reiterated its full-year Adjusted EPS guidance of $4.20 at the midpoint
- Operating Margin: 22.2%, down from 23.4% in the same quarter last year
- Free Cash Flow Margin: 23.2%, up from 21.7% in the same quarter last year
- Funeral Services Performed: down 4,168 year on year
- Market Capitalization: $11.98 billion
Company Overview
Founded in 1962, Service International (NYSE: SCI) is a leading provider of death care products and services in North America.
Revenue Growth
Examining a company’s long-term performance can provide clues about its quality. Any business can experience short-term success, but top-performing ones enjoy sustained growth for years. Unfortunately, Service International’s 2.7% annualized revenue growth over the last five years was weak. This fell short of our benchmarks and is a tough starting point for our analysis.
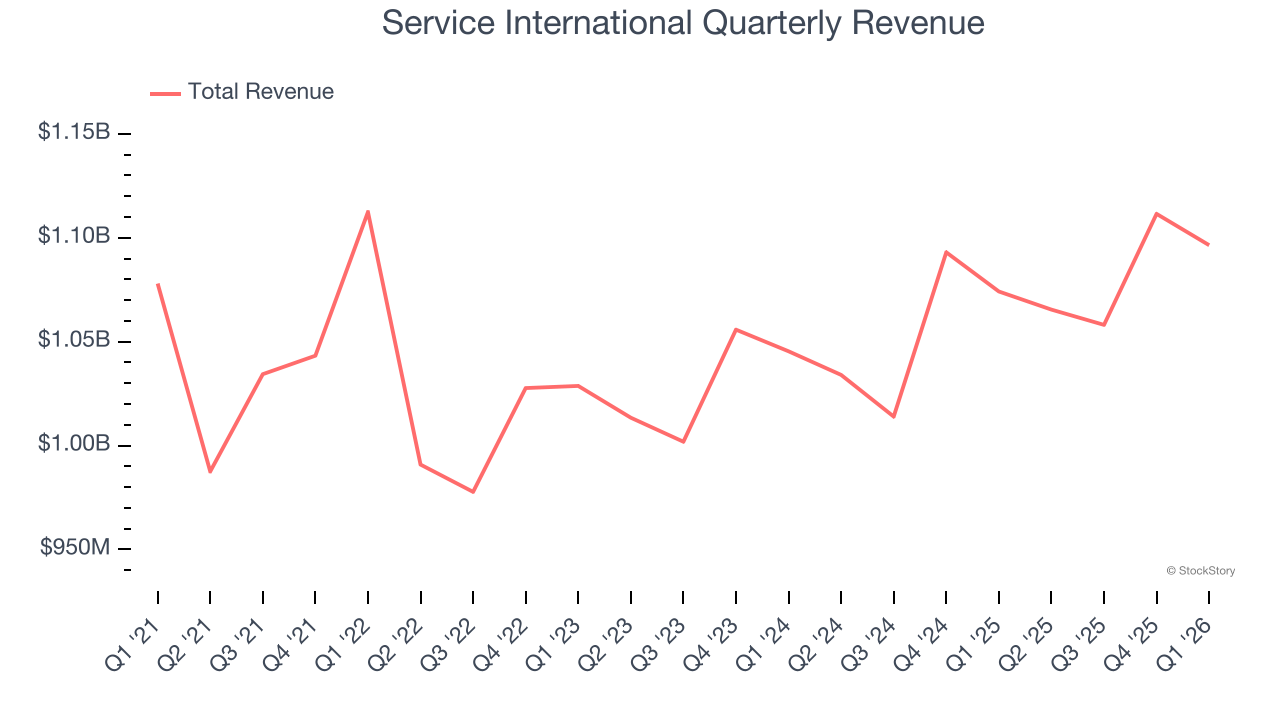
We at StockStory place the most emphasis on long-term growth, but within consumer discretionary, a stretched historical view may miss a company riding a successful new product or trend. Service International’s annualized revenue growth of 2.6% over the last two years aligns with its five-year trend, suggesting its demand was consistently weak. 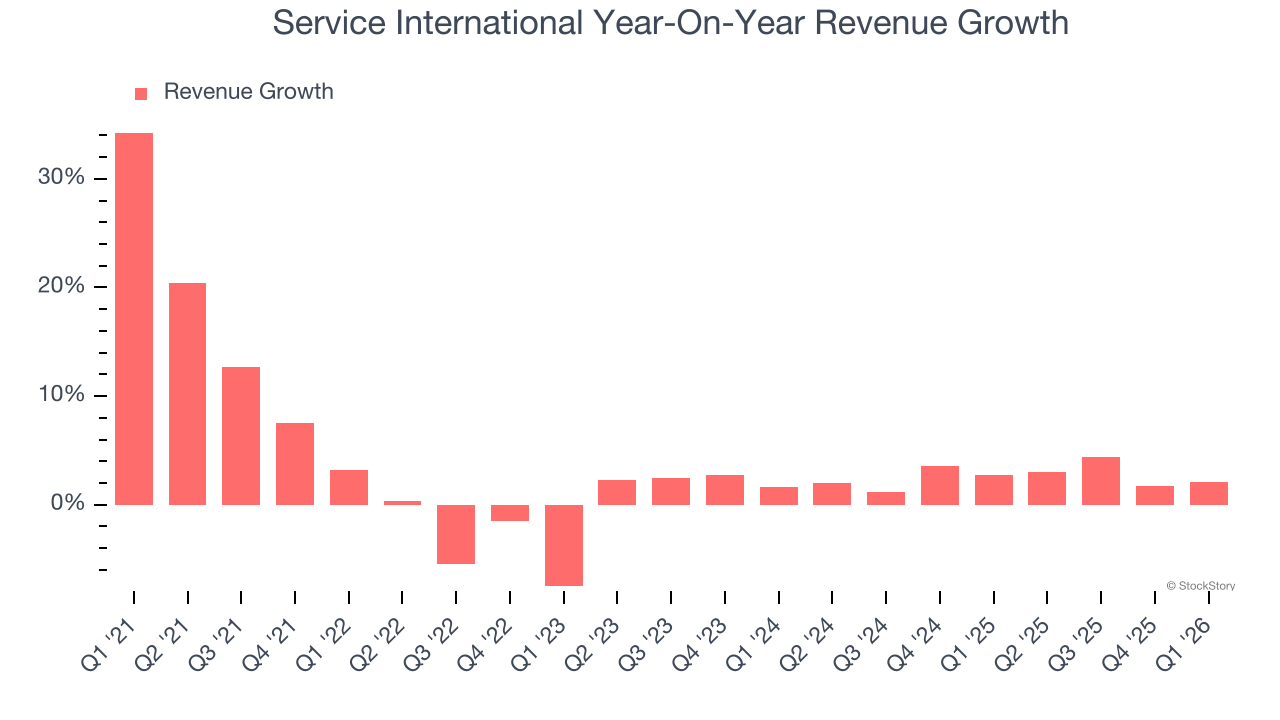
Service International also discloses its number of funeral services performed, which reached 93,686 in the latest quarter. Over the last two years, Service International’s funeral services performed was flat. Because this number is lower than its revenue growth during the same period, we can see the company’s monetization has risen. 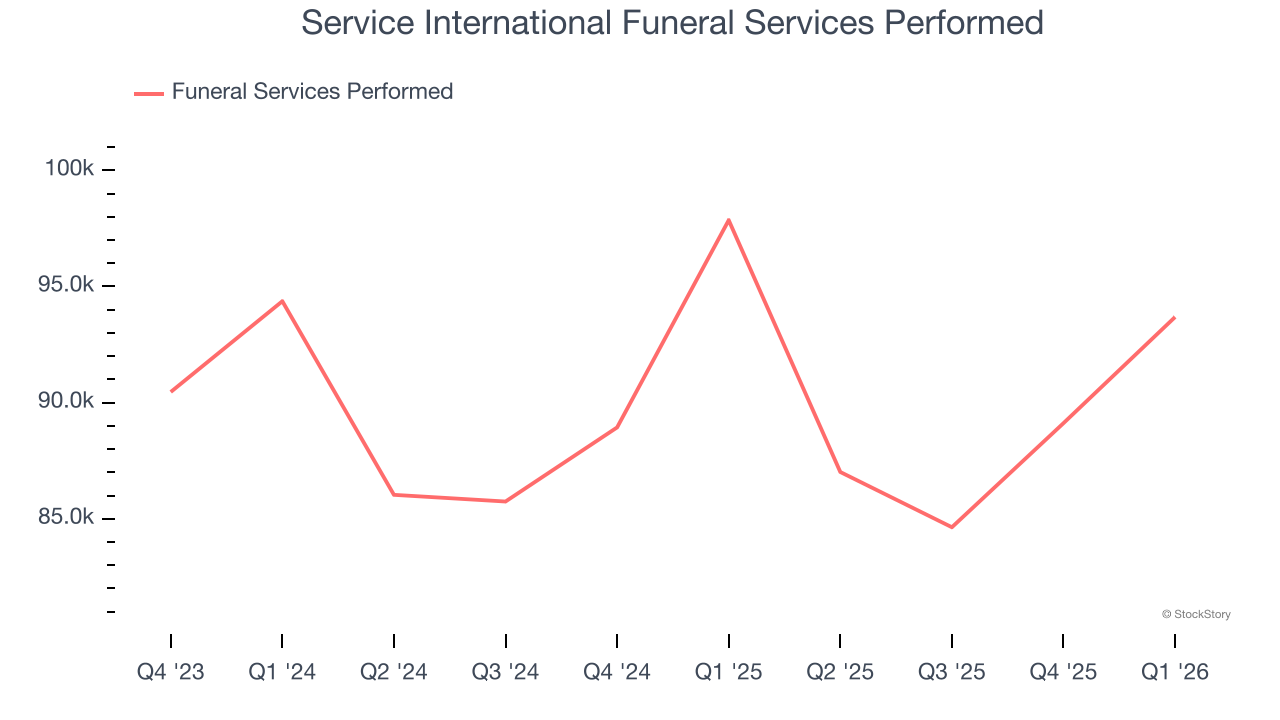
This quarter, Service International grew its revenue by 2.1% year on year, and its $1.10 billion of revenue was in line with Wall Street’s estimates.
Looking ahead, sell-side analysts expect revenue to grow 3.6% over the next 12 months, similar to its two-year rate. This projection is underwhelming and implies its newer products and services will not lead to better top-line performance yet.
ONE MORE THING: The $21 AI Application Stock Wall Street Forgot. While Wall Street obsesses over who’s building AI, one company is already using it to print money. And nobody’s paying attention.
AI chip stocks trade at ridiculous valuations. This company processes a trillion consumer signals monthly using AI and trades at a third of the price. The gap won’t last. The institutions will figure it out. You need to see this first. Read the FREE Report Before They Notice.
Operating Margin
Service International’s operating margin has more or less stayed the same over the last 12 months , and we generally like to see margin increases due to economies of scale and cost efficiency over time.
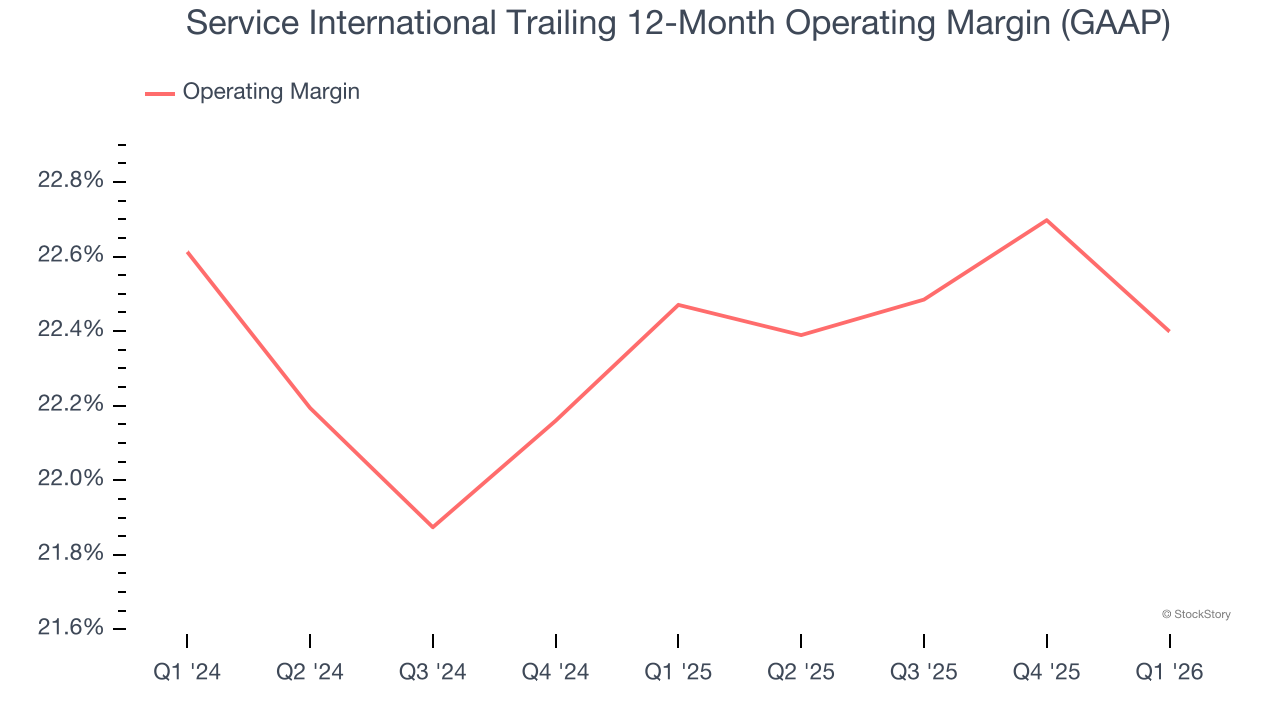
In Q1, Service International generated an operating margin profit margin of 22.2%, down 1.2 percentage points year on year. This reduction is quite minuscule and indicates the company’s overall cost structure has been relatively stable.
Earnings Per Share
Revenue trends explain a company’s historical growth, but the long-term change in earnings per share (EPS) points to the profitability of that growth – for example, a company could inflate its sales through excessive spending on advertising and promotions.
Service International’s flat EPS over the last five years was below its 2.7% annualized revenue growth. This tells us the company became less profitable on a per-share basis as it expanded due to non-fundamental factors such as interest expenses and taxes.
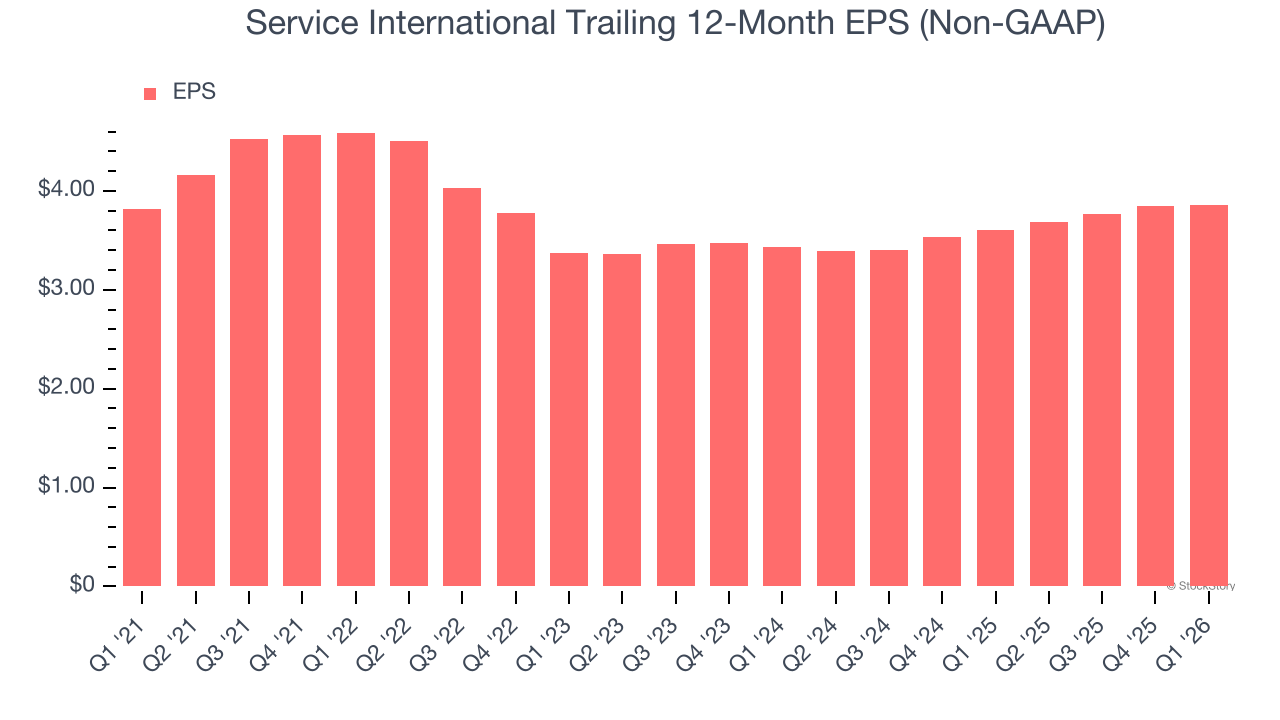
In Q1, Service International reported adjusted EPS of $0.97, up from $0.96 in the same quarter last year. Despite growing year on year, this print missed analysts’ estimates. Over the next 12 months, Wall Street expects Service International’s full-year EPS of $3.86 to grow 11.7%.
Key Takeaways from Service International’s Q1 Results
We struggled to find many positives in these results. Its EBITDA missed and its EPS fell short of Wall Street’s estimates. Overall, this was a softer quarter. The stock traded down 2% to $84.72 immediately after reporting.
The latest quarter from Service International’s wasn’t that good. One earnings report doesn’t define a company’s quality, though, so let’s explore whether the stock is a buy at the current price. When making that decision, it’s important to consider its valuation, business qualities, as well as what has happened in the latest quarter. We cover that in our actionable full research report which you can read here (it’s free).


